Reporting & Analysis
20.09.2024

TLDR
POAS (Profit on Ad Spend) provides a clearer measure of ad profitability compared to ROAS, as it focuses on actual profit rather than just revenue. This helps e-commerce businesses optimize ad spending by prioritizing campaigns that contribute most to the bottom line. Using tools like Airboxr, businesses can automate their POAS calculations and refine strategies based on profitability metrics.
In e-commerce, understanding the effectiveness of your advertising spend is crucial for maintaining profitability and scaling your business efficiently. Whether you're launching a new product or trying to increase visibility for your existing catalog, knowing how much profit your ads generate relative to their cost can transform your approach to marketing.
In this guide, we'll explore how to calculate the profitability of your ad spend manually, as well as automatically with Airboxr. We'll define essential terms like "gross profit" and differentiate between similar metrics like Return on Ad Spend (ROAS). Understanding these concepts will empower you to make informed decisions that can lead to more effective ad campaigns and improved financial outcomes for your store.
Understanding Gross Profit
Gross Profit is a key financial metric that helps e-commerce businesses gauge the profitability of their sales operations. It represents the difference between the revenue generated from sales and the direct costs associated with producing or acquiring the goods sold, known as the Cost of Goods Sold (COGS).
For example, selling 100 units at $50 each yields $5,000 as your total revenue. Then, account for the Cost of Goods Sold (COGS), which for 100 units at a production cost of $30 each totals $3,000.
Subtract the COGS from your revenue to find your gross profit. In this case, $5,000 minus $3,000 equals a gross profit of $2,000. This figure reveals your earnings before other expenses like marketing, administration, and other overhead costs, providing a clear snapshot of your sales profitability.
Gross Profit when represented as a percentage of your selling price is known as Gross Profit Margin, or Gross Margin. This is also referred to as Contribution Margin 1, or CM1.
Read about more profit metrics for your e-commerce business.
Understanding POAS vs. ROAS
When managing advertising as an e-commerce store, two important metrics to consider are Profit on Ad Spend (POAS) and Return on Ad Spend (ROAS). Each serves a distinct purpose in assessing advertising effectiveness.
Profit on Ad Spend (POAS) measures the gross profit earned for each dollar spent on ads, focusing on profitability rather than just revenue. It's calculated by dividing gross profit from a campaign by the ad spend. POAS helps evaluate how effectively advertising contributes to the bottom line.
Return on Ad Spend (ROAS), on the other hand, measures the total revenue generated for each dollar spent, offering a broad view of financial returns from campaigns. It's determined by dividing campaign revenue by ad spend and is key for assessing whether ad costs are justified by the revenue they generate.
POAS is a crucial metric for e-commerce businesses because it focuses directly on the profitability of advertising efforts. Unlike metrics that only track revenue, POAS considers the cost of goods sold, offering a clearer picture of what you're truly earning after covering product expenses. This makes it an invaluable tool for fine-tuning ad strategies based on actual financial gain rather than just sales volume.
By analyzing POAS, businesses can identify which ads are genuinely cost-effective, helping prioritize spending on campaigns that deliver the highest profit rather than those that simply drive high revenue. This approach supports more sustainable growth, ensuring that advertising budgets are invested in the most profitable initiatives.
Let's simplify the comparison between two ad campaigns to show how POAS provides clearer decision-making insights:
Financials:
Campaign A:
Ad Spend: $500, Revenue: $2000, Gross Profit: $500
Campaign B:
Ad Spend: $400, Revenue: $900, Gross Profit: $200
Calculations:
Campaign A:
ROAS: Revenue / Ad Spend = $2000 / $500 = 4
POAS: Gross Profit / Ad Spend = $500 / $500 = 1
Campaign B:
ROAS: Revenue / Ad Spend = $900 / $400 = 2.25
POAS: Gross Profit / Ad Spend = $200 / $400 = 0.50
Insight:
ROAS indicates that both campaigns are effective. Campaign A is more successful, generating $4 in gross profit for every dollar spent on advertising. However, when looking at the POAS, it shows that Campaign A breaks even, with every dollar spent on advertising generating an equal return of $1. On the other hand, Campaign B loses money, as one dollar spent on ads generates only 50 cents in gross profit.
This demonstrates how ROAS can be misinterpreted on profitability, while POAS reveals the true financial outcome, guiding better ad spending decisions.

Advantages of POAS over ROAS
Profit on Ad Spend (POAS) offers distinct advantages over Return on Ad Spend (ROAS) by providing a deeper insight into the actual profitability of advertising campaigns:
Focus on Profitability: While ROAS measures revenue generated per dollar spent, POAS evaluates the actual profit, considering both revenue and the cost of goods sold. This focus helps businesses understand not just the income but the real financial benefit of their ad spend.
Better Financial Decision-Making: By highlighting profit instead of revenue, POAS enables more accurate budgeting and financial planning. It ensures that advertising decisions are made based on their impact on the bottom line, leading to more financially sound marketing strategies.
Effective Resource Allocation: With POAS, companies can identify and invest more in the most profitable advertising campaigns. This targeted investment helps optimize marketing budgets, reducing waste on less effective ads.
Long-term Strategy Development: Understanding which ads are genuinely profitable assists in developing long-term strategies that sustain and grow business profitability, rather than just boosting short-term sales.
How to automatically calculate POAS with Airboxr
With Airboxr, e-commerce stores can automate their POAS calculation and measure success over time using our Profit on Ad Spend over Time report. Here’s how:
Step one: Select the Hop
Use the left sidebar to search for the automated report (or Hop) called “Profit on Ad Spend over Time” in the Hops Marketplace.

Step two: Customize your output
You can adjust the timeframe the report will cover and also filter sales channels (Shopify) to meet certain conditions like excluding subscriptions or wholesale orders for your reporting.
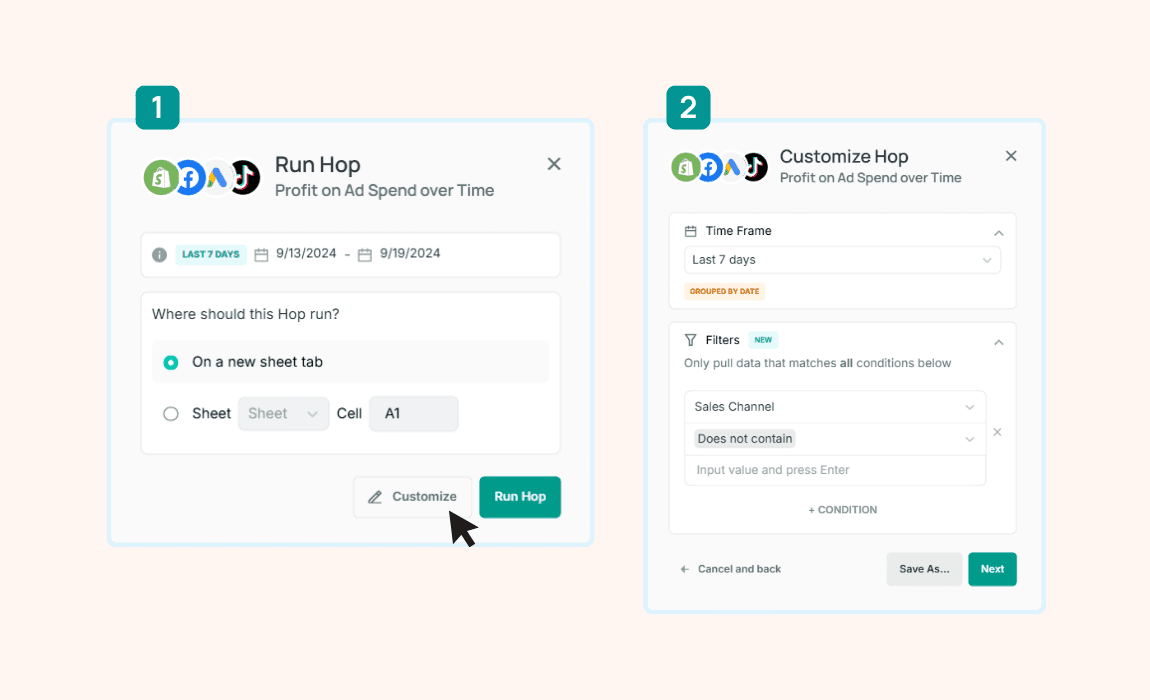
Step three: Run the hop
Now that you’ve customized the report parameters, you can run the hop.

Step four: Schedule your report (optional)
You can schedule this report to automatically update at any given time and interval of your choice to always have the latest data on your sheet.

Improve your DTC game. Sign up for weekly tips.
Limitations of POAS
While Profit on Ad Spend (POAS) is a valuable metric for assessing the direct profitability of ad campaigns, it has a major drawback that decision-makers should consider. POAS focuses solely on profit, potentially overlooking other benefits of advertising like brand awareness and customer loyalty which can also contribute to long-term revenue. To complement POAS, decision-makers should also consider metrics like:
Customer Lifetime Value (LTV): This measures the total revenue a business can expect from a single customer account. It helps understand the long-term value of all customers. Therefore, stores can adopt a strategy of an unprofitable first purchase (driven by ads), relying on subsequent purchases to generate profit. Stores with high repeat rates typically have a high Customer Lifetime Value (LTV).
Conversion Rate: Tracks the percentage of ad interactions that result in conversions, providing insight into the effectiveness of ad creatives and targeting. Poor conversion rates mean your ads are not cost-effective therefore translating to higher customer acquisition costs (CAC) and lower POAS margins.
These additional metrics help decision-makers gain a more complete view of their advertising's effectiveness and can better optimize their marketing strategies for both immediate returns and long-term growth.
In conclusion, while ROAS can offer a broad view of the revenue efficiency of ad campaigns, POAS provides a crucial insight into their actual profitability. This deeper analysis is essential for e-commerce businesses to ensure their advertising spending not only generates sales but also contributes positively to the bottom line.
