Tools & Templates
08.03.2024
TLDR
Airboxr automates e-commerce analytics into spreadsheets and Looker dashboards, simplifying data consolidation and visualization. It's ideal for Shopify and Amazon brands, offering customizable insights into sales, marketing, and operations to inform strategic decisions.
As an e-commerce business, you need to have an overview of everything that affects the revenues of the business. That includes sales, marketing, inventory, operations, and so on.
The problem is, that all of your reports live on different platforms. How do you combine and consolidate your reports, to get an accurate picture of your business health?
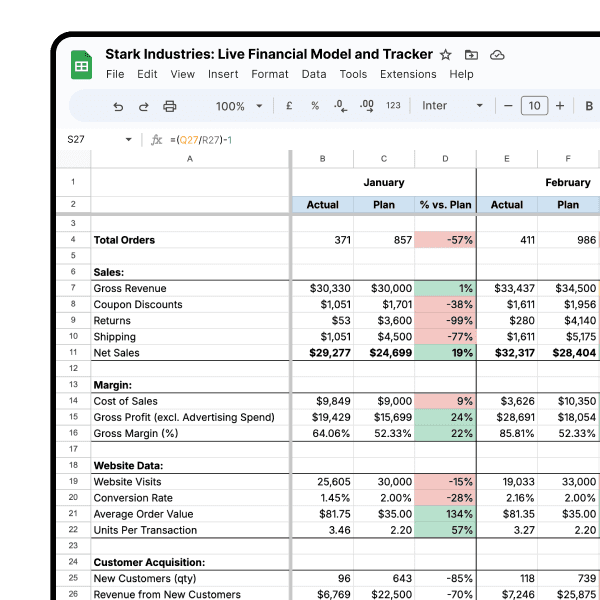
More often than not, e-commerce businesses turn to spreadsheets as their unified source of truth. Spreadsheets are powerful, yet flexible, offering e-commerce operators the ease of creating custom reports while maintaining the granularity of data needed for deep dives into specific analysis.
However, spreadsheets do have one disadvantage: they are not easy to read. If you don't yet know what you're looking for, you likely will have difficulties finding the insights you need.
That's where data visualization comes into play. Visual dashboards with graphs and charts can show you trends in your business, helping you spot anomalies, and giving you an indication of where to focus your attention. It's the first step towards understanding what's going on in your business.
At Airboxr, we've helped clients set up over 50 Looker dashboards tailored to their specific needs. We've learned what the most important metrics to show on Looker for rapidly growing DTC brands, and we've consolidated them into these 8 reports. Check them out:
Looker Report 1: Overview

Looker Report 2: Sales Trends

Looker Report 3: Top Products

Looker Report 4: Meta Ads Performance

Looker Report 5: Google Ads Performance

Looker Report 6: ROAS Trends

Looker Report 7: Checkout Funnel

Improve your DTC game. Sign up for weekly tips.
Looker Report 8: Operations

Additional Notes:
Looker is also a great way to consolidate data across multiple accounts on the same dashboard, which is important if you run ads on multiple ad accounts, or have multiple Shopify instances.
You can show time period comparisons on Looker, just as you can on spreadsheets.
In Looker, there are also drill-downs and drill-ups that allow you to move from daily, to monthly, to quarterly views on time charts.
You can put multiple metrics on the same charts and choose which you would want to see by the same dimension (e.g. on the charts with “+” in their title)
Airboxr is a revenue analytics platform for e-commerce brands. It surfaces business insights by automating reports onto spreadsheets. Airboxr helps you track sales, marketing, profit, and operations analytics and is highly customizable to your business needs. Use Airboxr to easily consolidate metrics across data platforms, and hook them up to a Looker dashboard. Best for brands selling on Shopify and Amazon. View a demo of the platform, and learn more about our custom report building services.


