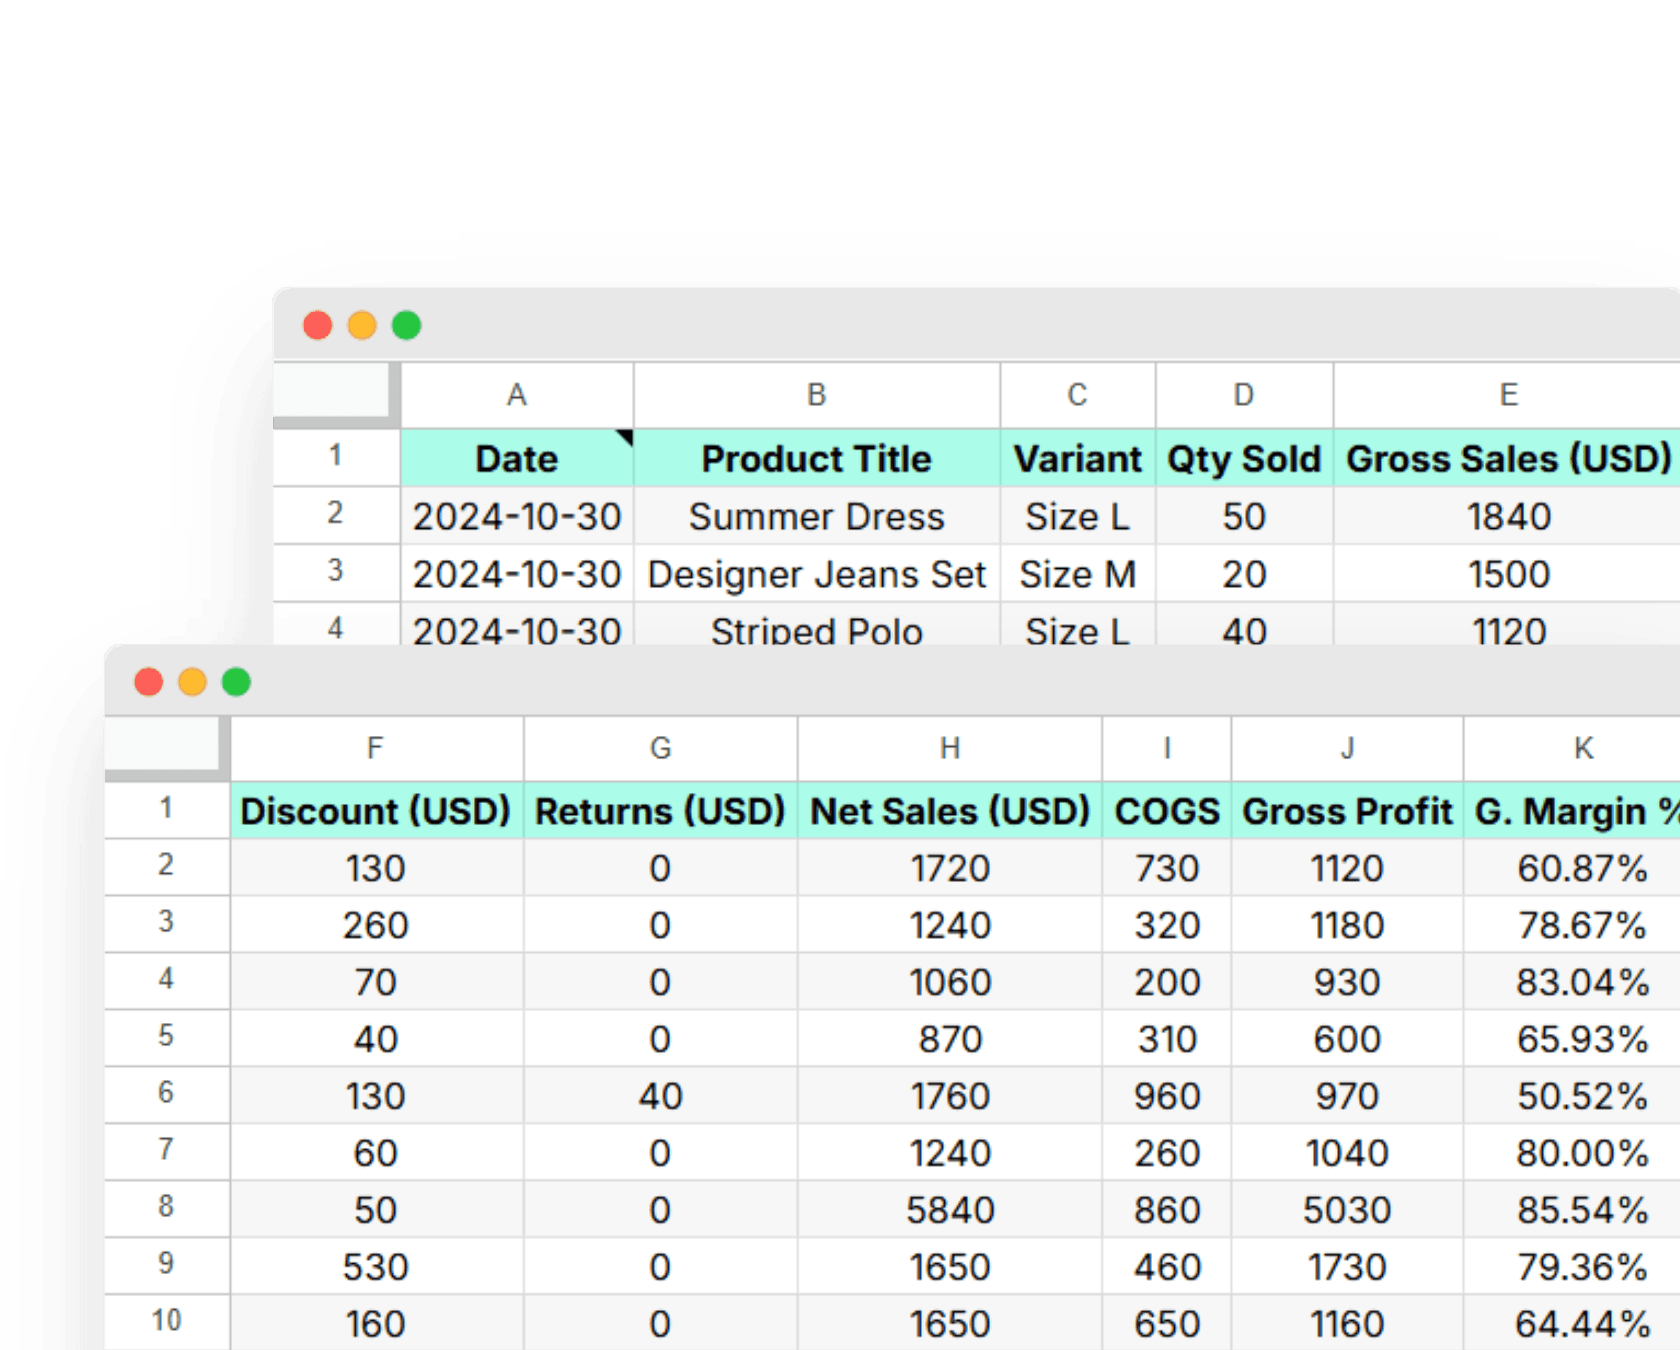
Measure the profitability of your product variants to uncover sale trends.
Only four steps to run your first report
Run automated report
Login with Google
Connect your store
View results
Trusted by global DTC brands
This report gives you daily sales performance metrics of your product variants including their daily profits (gross margin). With this report, you would be able to track how much profit each product is generating alongside the number of orders, quantity ordered, sales value (gross and net), discount, and returns value of product variants on a daily basis.
You can also filter this report by product title, variant title, SKU, Vendor, and total sales value to create segments and track their performance.
Schedule this report to always have the latest data and connect to a Looker dashboard for clearer insights.
Integration(s)
How to use this Hop.
Simply create an Airboxr account and connect your Shopify store to automatically run this export/analysis for your store. If you already have an account, click on the Add to my Collection button above.
Performance Tracking and Comparison: E-commerce stores can use this report to track the daily performance of each product variant, measuring key metrics and comparing the performance of different variants over time. This allows businesses can identify top-performing products and those that may require attention or adjustments.
Profit Analysis: The inclusion of gross profit and gross margin metrics allows users to assess the profitability of each product variant. Understanding the contribution of each variant to overall profit provides valuable insights into the product mix, helping businesses make informed decisions about inventory management, pricing strategies, and product promotions.
Identifying Trends and Seasonal Patterns: By reviewing daily sales metrics over time, e-commerce stores can identify trends and seasonal patterns for each product variant. This information is valuable for planning promotions, adjusting inventory levels based on seasonality, and optimizing marketing efforts during peak periods.
Discount and Returns Analysis: The report provides insights into the impact of discounts and returns on each product variant's performance. E-commerce stores can assess the effectiveness of discount strategies, identify products with high return rates, and refine pricing and promotional approaches to mitigate returns and improve overall profitability.
Inventory Management: Daily tracking of quantity sold and inventory-related metrics assists in proactive inventory management. Businesses can identify fast-moving products, potential stockouts, or overstock situations. This information is crucial for maintaining optimal inventory levels, preventing stockouts of popular items, and minimizing carrying costs.
In This Report
Metrics
Quantity Sold
Gross Sales
Discount
Returns
Net Sales
Tax
Total Sales
Cost of Good Sold
Gross Profit
Gross Margin
Grouped By
Date
Variant ID
Vendor
Product Title
Product Type
Variant SKU
Connect your Shopify store and automate this report. You will never have to manually work with data again.


