Growth Strategies
Mar 19, 2023
TLDR
Marketing agencies must share detailed analytics with Shopify clients to build trust and inform data-driven decisions. Tracking key metrics like traffic, conversion rates, AOV, and customer lifetime value aids in optimizing e-commerce performance. Tools like Google Analytics, Hotjar, and Shopify's dashboard streamline data collection. Centralizing data with Airboxr provides a holistic view of business health. Sharing analytics fosters transparency and collaborative optimization for client success.
As a marketing agency, you may be tempted to keep your analytics data to yourself, like a hoarder keeping all their treasures to themselves. But in reality, sharing detailed analytics with your Shopify clients is crucial to building trust and ensuring their success. Here are just a few reasons why.
Sharing detailed analytics with your clients demonstrates your agency's expertise and transparency. By showing your clients exactly what's working and what's not, you're able to build trust in your abilities by providing actionable insights. When your clients understand the data behind your marketing strategies, they're more likely to be on board with your recommendations and invest more in your services.
Additionally, sharing detailed marketing analytics and data visualizations can help your clients make better business decisions. With insights into customer behavior, sales patterns, and website performance, your clients can make data-driven decisions about inventory, pricing, and marketing strategies. By arming your clients with this information, you're empowering them to take control of their e-commerce business and achieve greater success.
Doing this right already puts you in the top 20-percentile of digital marketing agencies. So don't be a data hoarder—share your analytics with your clients and watch your agency's success soar!
Now that we've got that out of the way, let's begin with a deep dive into the metrics that you should be reporting on.
Key metrics agencies should track.
Analytics play a crucial role in helping marketing agencies optimize their Shopify clients' e-commerce businesses. You should make the most of efficient client reporting, while keeping in mind that you are not technically providing analytics services—your core business is still ensuring the effectiveness of your marketing campaigns. Many agencies don't have an analytics team or data scientists to start with, so try to automate as much of this process as you can.

Agencies aren't data analytics teams, but providing insightful data to your clients can go a long way to building trust.
Here are some of the key metrics that you should be tracking for your Shopify clients and why they're important:
Traffic metrics
Tracking web analytics metrics can provide insights into which channels are driving the most valuable traffic to a Shopify store. This information—typically taken from Google Analytics—can help agencies optimize their clients' digital marketing efforts and focus on channels that are most likely to drive conversions. For example, a Shopify client selling luxury handbags might find that their most valuable traffic comes from Instagram influencers, and could allocate more budget to influencer partnerships.
Conversion rate
The conversion rate measures the percentage of website visitors who take a desired action, such as making a purchase or signing up for a newsletter. Tracking this metric from Google Analytics can help agencies identify bottlenecks in the sales funnel and optimize their clients' website design and user experience. For example, a Shopify client might find that their conversion rate is low on mobile devices, and could make design changes to improve the mobile experience.
Average order value (AOV)
The average order value measures the average amount of money spent per transaction on a Shopify store. Tracking this metric from Shopify can help agencies identify opportunities to increase revenue, such as cross-selling and upselling. For example, a Shopify client selling workout apparel might find that customers who purchase leggings are also likely to purchase sports bras, and could create product bundles to encourage customers to purchase both items.
Customer lifetime value (LTV)
The customer lifetime value measures the total value of a customer to a Shopify store over the course of their lifetime. This metric—calculated from Shopify data—can help agencies identify high-value customers and target them with personalized marketing campaigns. Typically you will need access to a reporting tool to calculate this for you. For example, a Shopify client selling home decor might find that customers who purchase high-end furniture are also likely to purchase luxury bedding, and could create email campaigns targeting these customers with personalized product recommendations.
How agencies can use data to maximize their impact.
Agencies can use analytics data from multiple sources—including Shopify, ad channels like Google Ads, Facebook Ads, TikTok Ads, traffic channels like Google Analytics, and email platforms like Klaviyo—to segment customers better and (where possible) improve the user experience.
Start with segmenting customers in the following ways:
Using analytics to identify high-value customers
By tracking metrics like AOV and LTV, agencies can identify customers who are likely to be the most valuable to a Shopify store. These customers can then be targeted with personalized marketing campaigns to encourage repeat purchases. Learn how to identify high-value customers.
Targeting customers based on purchase history
By analyzing customers' purchase history, agencies can identify opportunities to cross-sell and upsell. For example, a Shopify client selling coffee might find that customers who purchase whole beans are also likely to purchase coffee grinders, and could create email campaigns targeting these customers with product recommendations.
Personalization through segmentation
By segmenting customers based on demographic or behavioral data, agencies can create personalized marketing campaigns that resonate with each segment. For example, a Shopify client selling skincare products might segment customers by age and create targeted campaigns for each age group, highlighting the specific benefits of the products for each demographic.
Once you have analyzed the key personas that buy from your client's store, analyze the store itself to determine if the experience can be optimized:
Use analytics to identify bottlenecks in the sales funnel
You know the drill. Visitors arrive at the website, browse a bit, add an item to their cart, and...poof! They disappear into the ether, never to be seen again. But why? With analytics, you can identify where in the sales funnel visitors are dropping off and take steps to fix it. Maybe the checkout process is too convoluted, or the shipping fees are too high. By pinpointing the bottleneck, you can make the necessary changes to keep visitors engaged and clicking that "buy" button.
Conduct A/B tests to improve conversion performance
What's the secret to a successful Shopify store? It's simple: testing, testing, and more testing. With A/B testing, you can experiment with different versions of your website to see which performs better. Maybe changing the color of the "buy" button from blue to red results in a 5% increase in conversions. Or maybe moving the "related products" section above the product description leads to more upsells. With analytics, you can track the results of your A/B tests and make data-driven decisions about how to improve your clients' Shopify stores.
Track user behavior to optimize Shopify store design and user experience
Let's face it: a clunky, outdated website is a turn-off for customers. But how do you know what changes to make to improve the design and user experience? By tracking user behavior, you can identify which parts of the website are causing frustration or confusion. Maybe visitors are struggling to find the search bar, or they're getting bogged down in a complicated navigation menu. Armed with this information, you can make strategic design changes to improve the overall user experience and keep customers coming back for more.
Improve your DTC game. Sign up for weekly tips.
What tools can marketing agencies use for analytics?
Now, let's talk about the tools available to marketing agencies for managing analytics. You may not have data analysts or business intelligence folks in your team to run advanced analytics—so you need the right tools to make sure you aren't spending all your time on data collection and cleaning. Here are some tips to get started.
Measure traffic through Google Analytics
The most popular tool for managing traffic analytics is Google Analytics. This powerful platform allows you to track website traffic, user behavior, and conversion rates, among other metrics. With Google Analytics, you can set up custom reports and dashboards, track e-commerce data, and even integrate with other Google products like Google Ads and Google Tag Manager. Make sure to connect Google Analytics to your client's Shopify platform to ensure the right data is flowing through.
Understand on-site user behavior using Hotjar
Hotjar allows you to track user behavior on your clients' websites, using heatmaps, recordings, and feedback tools. With Hotjar, you can see exactly how users are interacting with your clients' sites, where they're getting stuck, and what changes you can make to improve the user experience. It's like having a virtual user testing lab, without having to bribe people with free snacks to come in and test your site.
Measure business impact using Shopify dashboard
Last but not least, let's talk about the Shopify Analytics dashboard. This built-in tool allows you to track sales, orders, and inventory across all your clients' Shopify stores. With the Shopify Analytics dashboard, you can see which products are selling the most, track customer lifetime value, and even analyze the performance of your marketing campaigns.
Pull all data together to measure business health using Airboxr
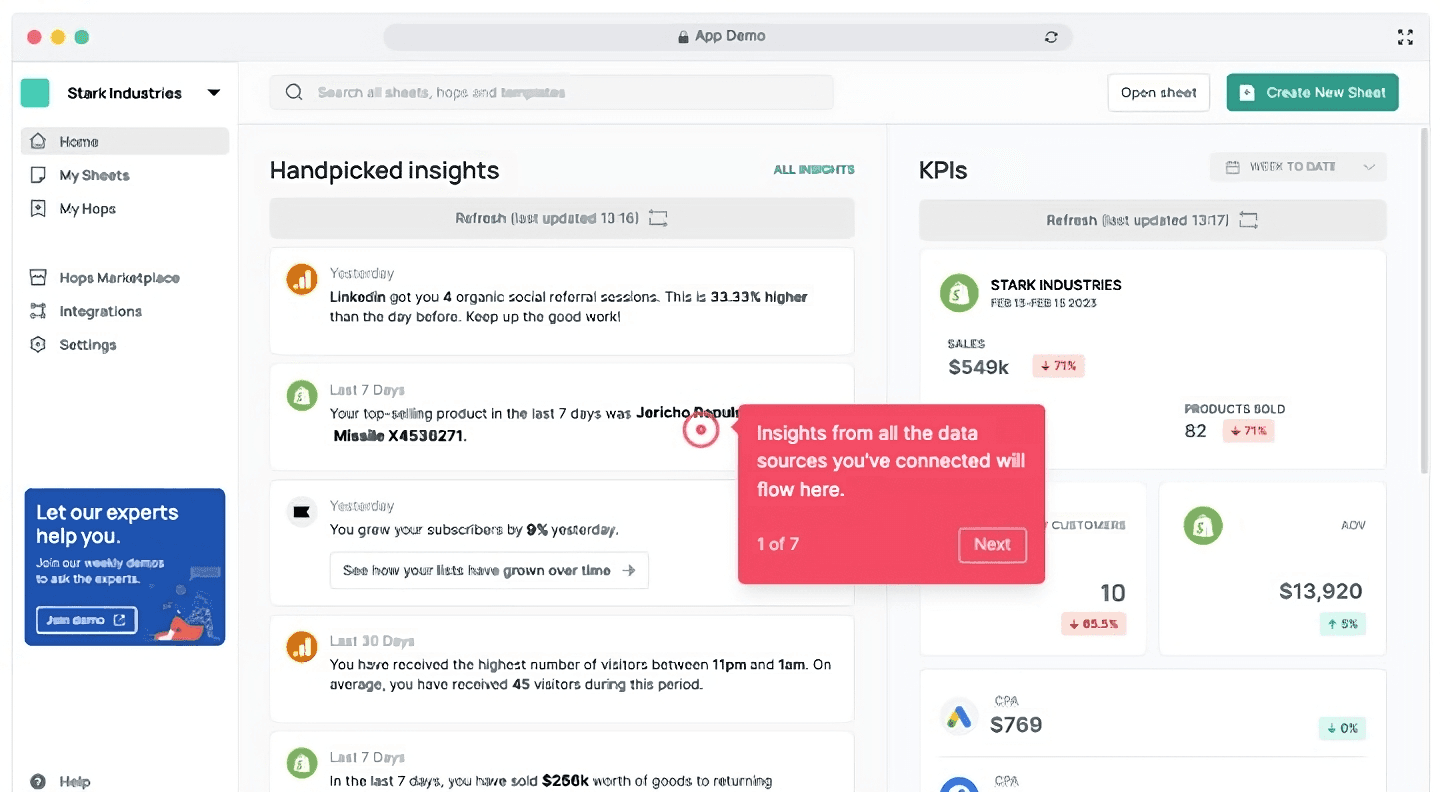
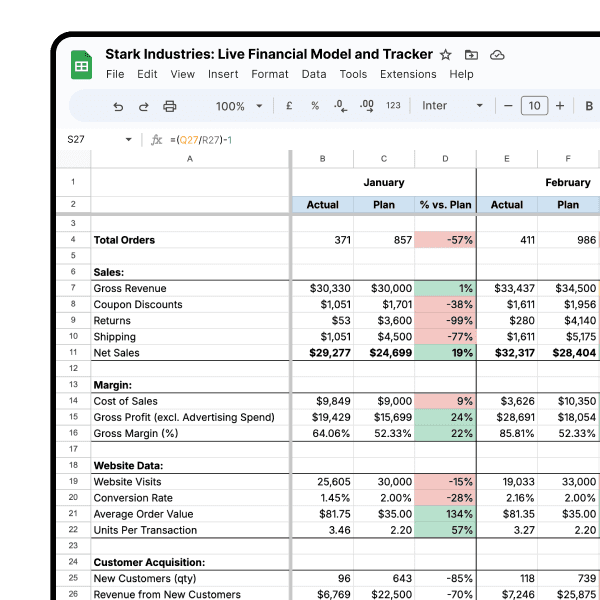
In the end, your clients want to see what impact your efforts are having on the business. A single measurement tool will likely never be enough to gain a comprehensive picture of the business. You need to pull together data from all of your sources into a central location to get the full picture. Use Airboxr's automations to pull data from your advertising, emailing, and revenue sources together and show your clients the bottom-line impact you are achieving for them.

Airboxr collates your data from all your sources and highlights the actions that need your attention. Try out the interactive demo here.
Analytics is the backbone of any successful marketing strategy, and Shopify stores are no exception. By tracking key metrics like traffic sources, conversion rates, and user behavior, marketing agencies can gain invaluable insights into their clients' online performance and make data-driven decisions to improve it.
It's not ideal to keep all that data to yourself. To truly drive your clients' success, you need to be transparent about your analytics and share the insights you've gathered with them. You can then work together to identify pain points in the sales funnel, experiment with new design elements, and continuously optimize the user experience.


