Reporting & Analysis
May 5, 2023
TLDR
To create a daily order report by payment; find your Shopify orders by payment method, then import them into Google Sheets. If you want to automate this, use Airboxr and as a bonus, you can integrate this data into a Looker report for presentations and schedule automatic updates using Airboxr.
This article is about creating a customized report of daily orders by payment method. If you’re looking for a more detailed daily report of gross sales by payment method, read this article.
When looking at e-commerce orders, it’s important to get an overview of what payment methods are used by your customers. This is important because you need to know which payment methods are preferred by your customers, know how they drive sales, which ones can be retired, and so on. For example, knowing what percentage of orders are coming from prepaid methods vs. BNPL vs. cash is essential to understand what kind of products to list, how to price in the risk of unpaid orders, and so on. For such an overview, a Sales by Payment Method report is very useful to review over time.
One particular metric that has been important for e-commerce businesses—especially in Asia—is cash on delivery (COD) payments. This metric shows how many orders were made which are to be paid in cash upon delivery of the items in the order. Being able to know how many orders are meant to be paid for by COD is essential for a business in order to track if the orders did eventually get paid, or if they did not end up being paid for, which would then require follow up action.
Creating this report can be tricky, however. Once you start trying to put the report together, you run into complications—such as how to combine all your cash payments together, and compare them to the prepaid payments. In Shopify, they may be all listed out as separate payment methods, which you would then have to manually combine in your report every week or month. This manual effort can take hours out of your week.
Don’t you wish you could automate this reporting work?
Well, you can.
In this article, we’ll show you:
How to find orders by payment method on Shopify
To get a report of your orders by payment method on Shopify, go to the menu on the left of your Shopify Admin, click on Analytics > Reports, filter by ‘payment’, and select the ‘Payment by type’ report.
See the screenshot below for how this looks:
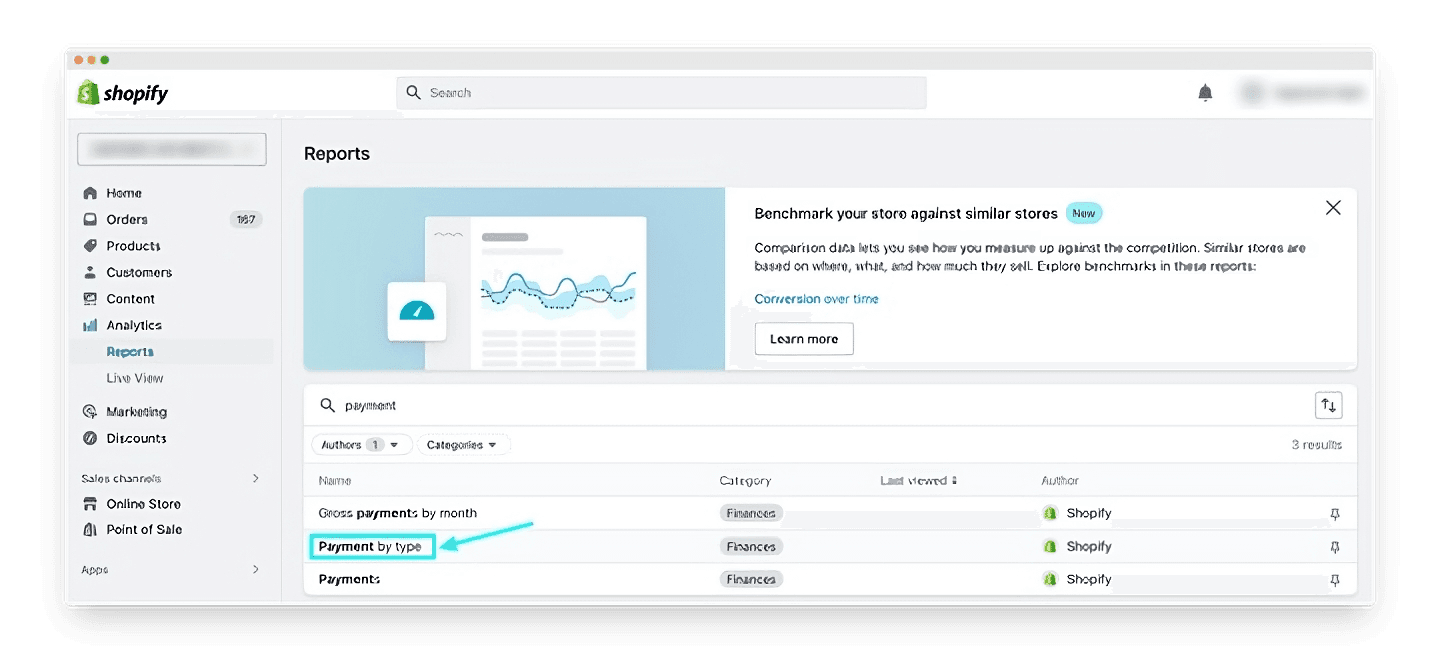
This gives you a report of every single order on your store, and which payment method was used for each order.
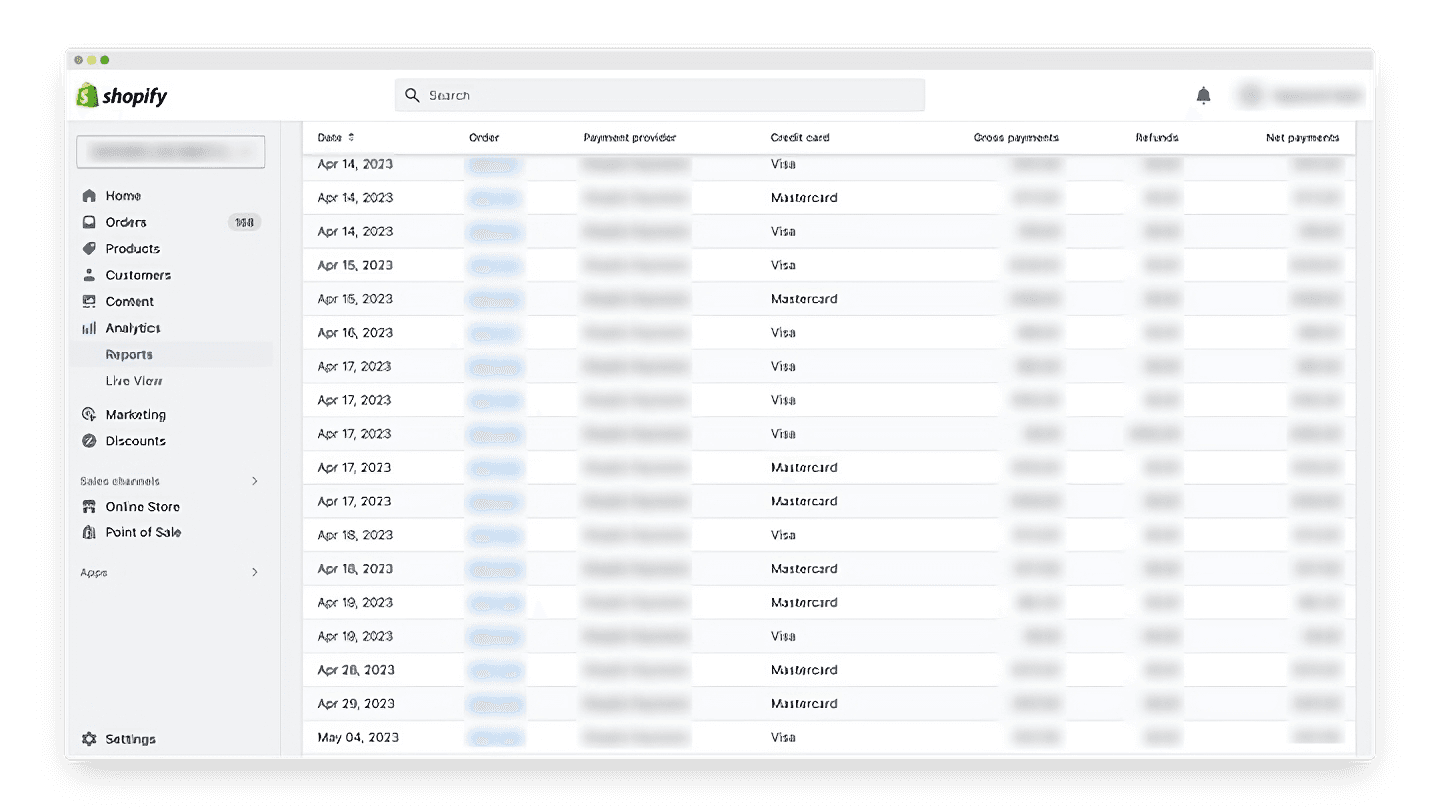
For a DTC store processing hundreds of orders every single day, this can be overwhelming. It’s not helpful if you’re looking for a daily order report by payment method.
For that, you would have to get this report into a Google Sheet, and do some filtering and/or grouping to get the information you need.
How to get orders by payment method into a Google Sheet (automatically)
The typical process to get your Shopify payment by type report into a Google Sheet is:
Export your report to a CSV file.
Download the export.
Upload it to Google Sheets.
If you want to do this automatically, you can use Airboxr. You won’t have to download any files; Airboxr imports your data directly into a Google Sheet. You can then run the import on a schedule so you never have to manually import the data again.
To get your orders by payment method into a Google Sheet automatically, you can use the Order Count by Payment Method over Time Hop.
This is how the imported data will look:
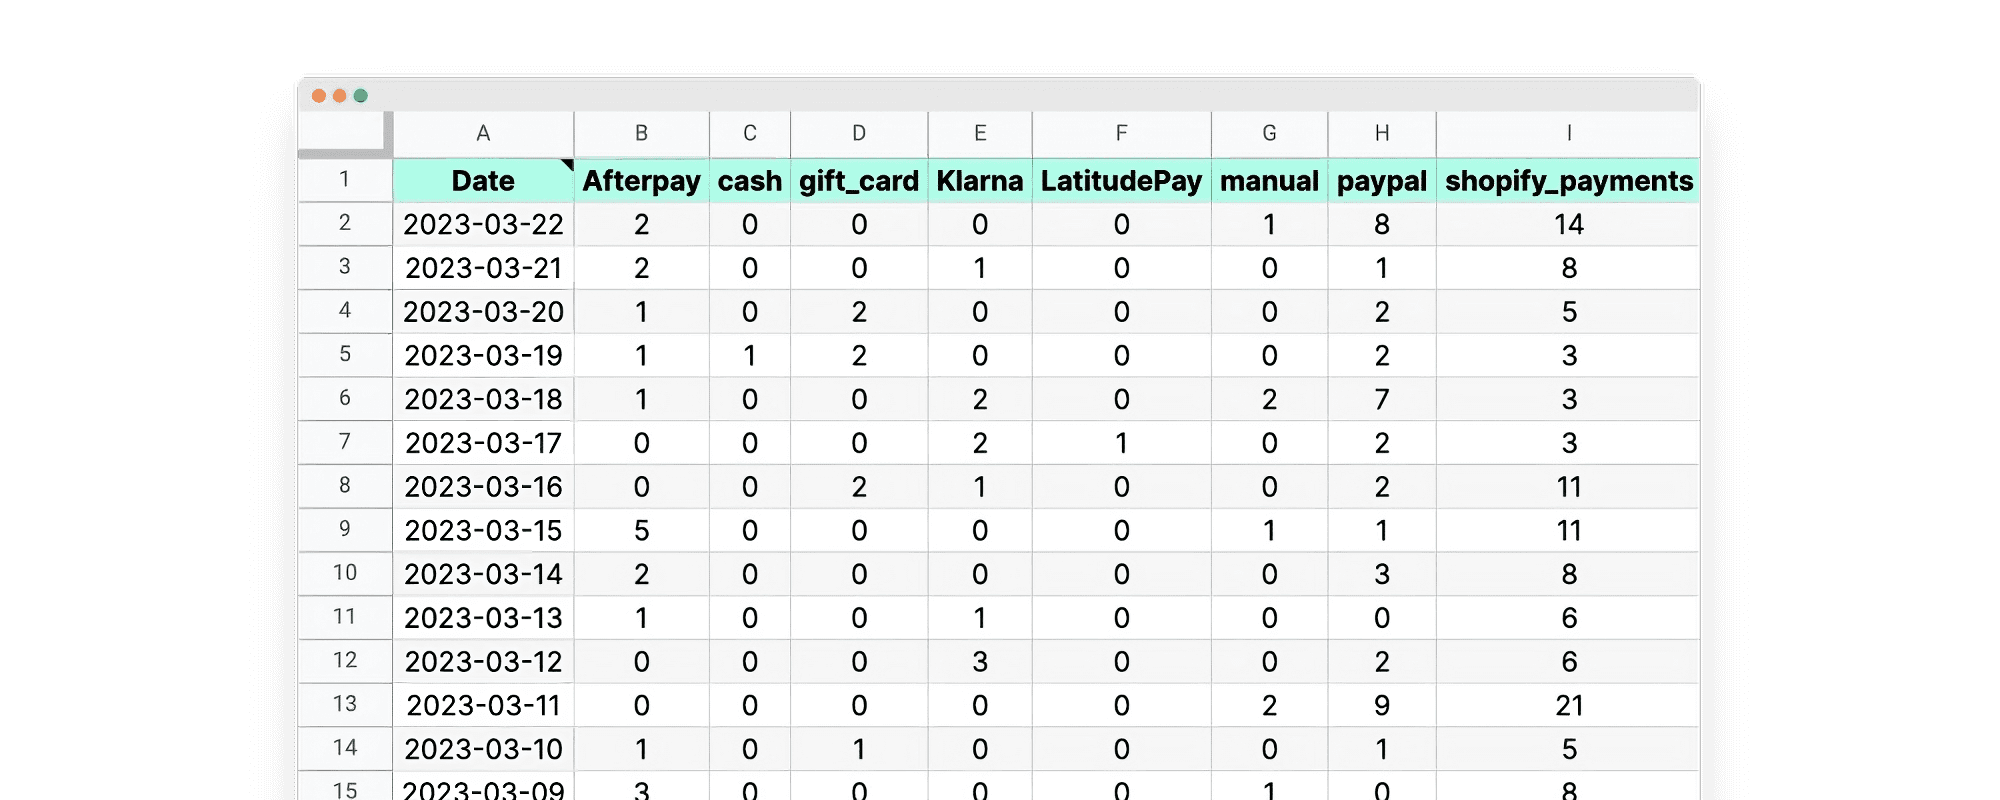
From here, you can create your customized report, grouping different payment methods together according to your internal reporting needs.
How to combine payment methods in Google Sheets (using just one formula)
So how do you create your customized report?
This is where the magic happens. Pay close attention now.
In our example, let’s say we’re looking at separating our payments by COD (cash on delivery) and prepaid payment methods.
For this example, this is what the imported sheet might look like:
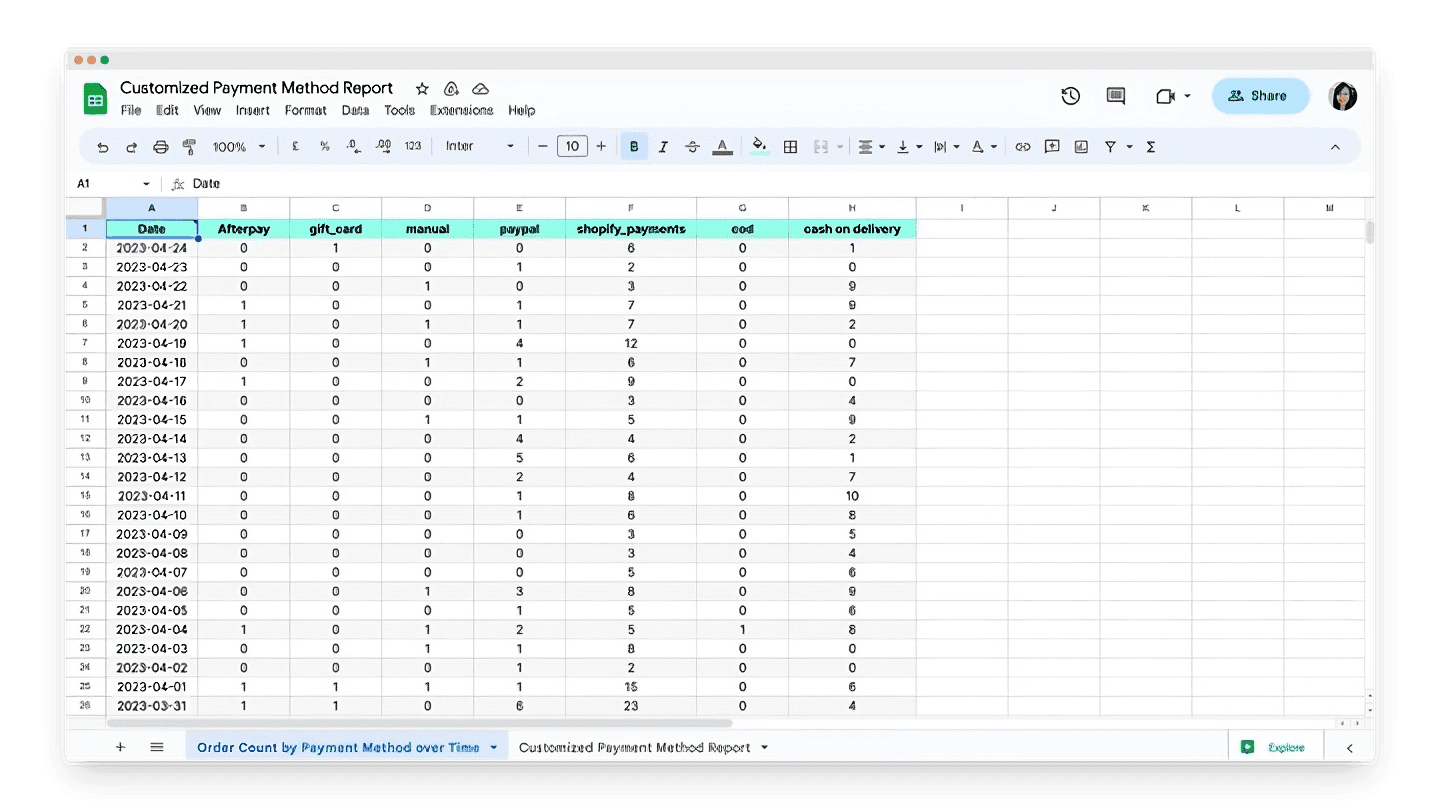
To separate prepaid methods from cash payments, you want to group columns G & H as COD payments, and group columns B to F as prepaid payments.
This is how you do it:
Create a new worksheet on your Google spreadsheet.
Use a formula to pull data from the previous sheet, group them according to your preference, and summarize them.
Improve your DTC game. Sign up for weekly tips.
Here’s how the new sheet (and formula) looks like:
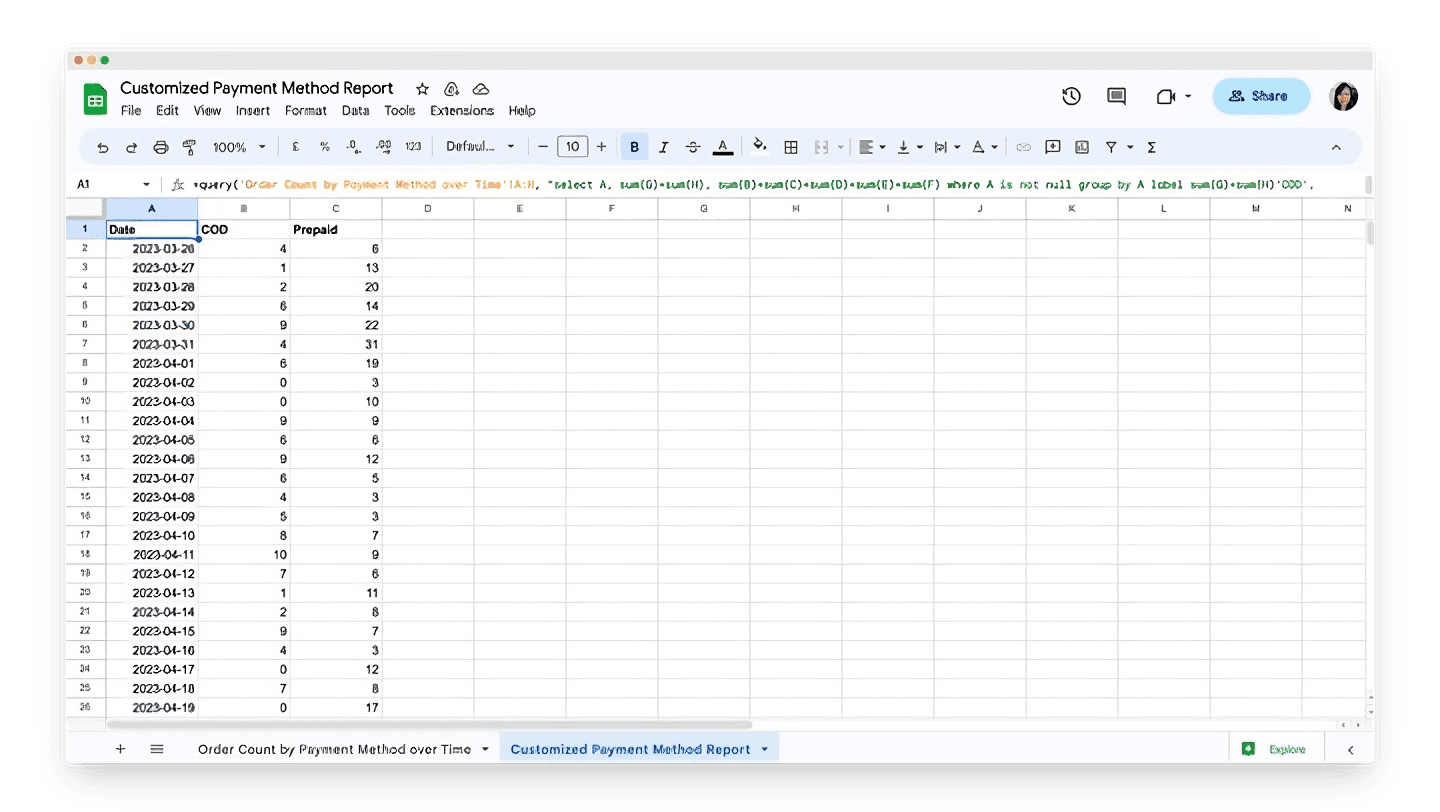
This formula does two important things:
Groups the related columns together.
Labels the columns accordingly.
And this is the formula for you to easily copy and modify as you need (modify the parts in bold):
=query('Order Count by Payment Method over Time'!A:H, "select A, sum(G)+sum(H), sum(B)+sum(C)+sum(D)+sum(E)+sum(F) where A is not null group by A label sum(G)+sum(H)'COD', sum(B)+sum(C)+sum(D)+sum(E)+sum(F)'Prepaid'")
And that’s it! Now you have a daily summary of all your orders, grouped by your specified payment method categories.
Bonus: Create a Looker report
Now that you’ve organized your data on a sheet, you can easily plug this data into your Looker report. All you have to do is add this sheet as a data source to your report, create a chart or graph, and you have this information on your dashboard ready to present at your monthly meeting. Read more on how to set up a Looker report.
Bonus 2: Run your analysis on schedule
Now you have your customized report in your spreadsheet. You have your Looker report for presentations. What could be more perfect than this?
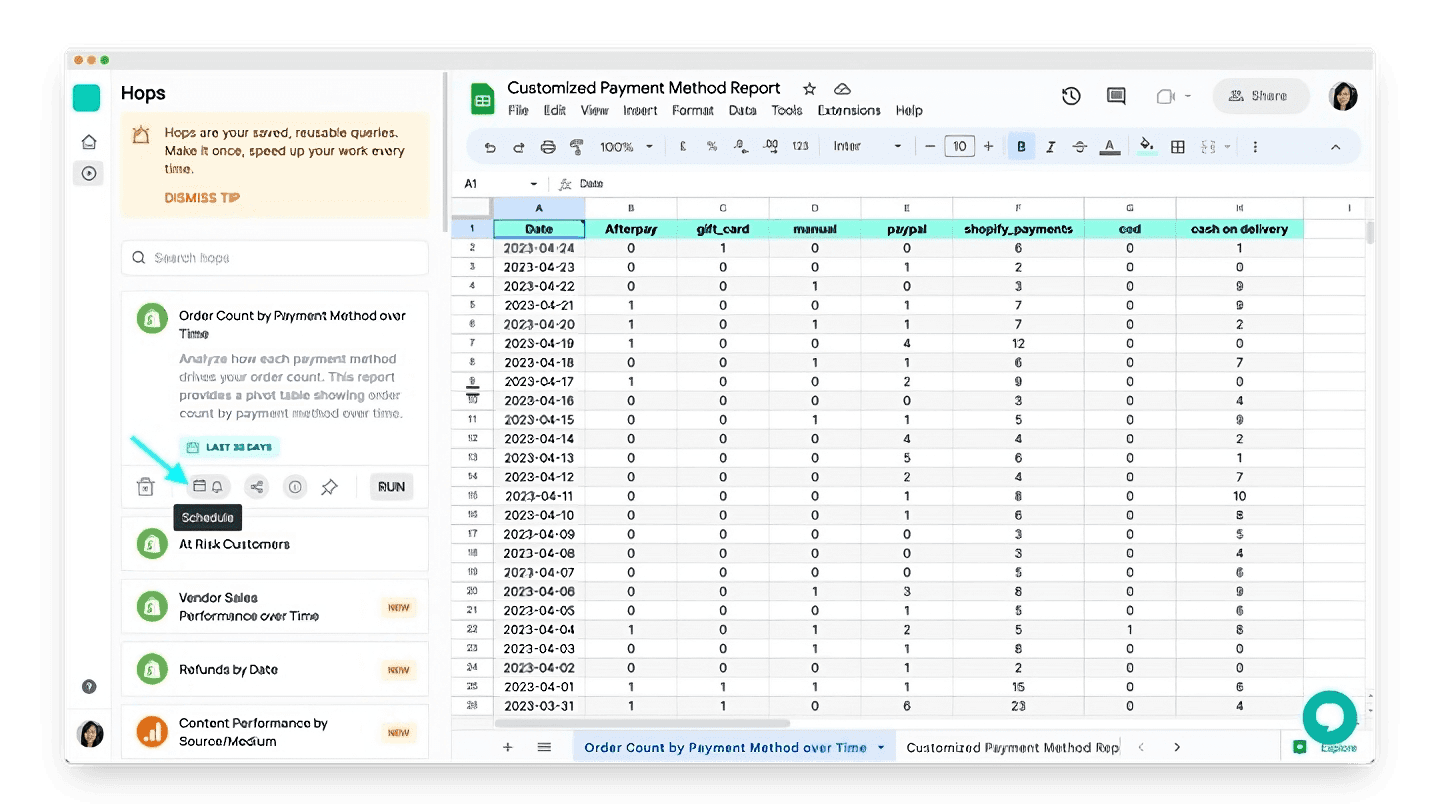
Yup. Running your report on a schedule, so that it updates automatically.
Scheduling your report in Airboxr is as easy as clicking a button.
We’re more than happy to offer personalized support to our customers. If you’d like help setting up your report, simply ping us on the in-app chat!
