Reporting & Analysis
Apr 13, 2023
TLDR
Managing ad reports for multiple e-commerce stores is labor-intensive. Looker Studio offers a solution with templates that automatically update. This guide explains how to set up your Google spreadsheet report powered by Airboxr, connect it to Looker Studio, and create a dashboard using Hops for data extraction. You can customize reports based on your metrics and easily refresh data in Looker. Request the provided template or inquire about custom ones for your needs.
Creating a performance marketing ad report for one e-commerce store is already a tedious task. You have to go in to multiple ad platforms, filter for the data you need, make sure the data types match so you can make comparisons, and then download and clean CSV files—or even more laborious, copy and paste the data into your spreadsheet.
If you have multiple stores to report on, imagine replicating that process by the number of stores you have. It’s simply not scalable!
Today, we’re giving e-commerce managers and performance marketing agencies the smart solution to creating multiple reports on a regular basis—using our Looker Studio templates. We’ll show you how we created a template on Looker, powered by Airboxr so it updates automatically. At the end, you can request the template for yourself, or speak to us if you want a template custom made for you.
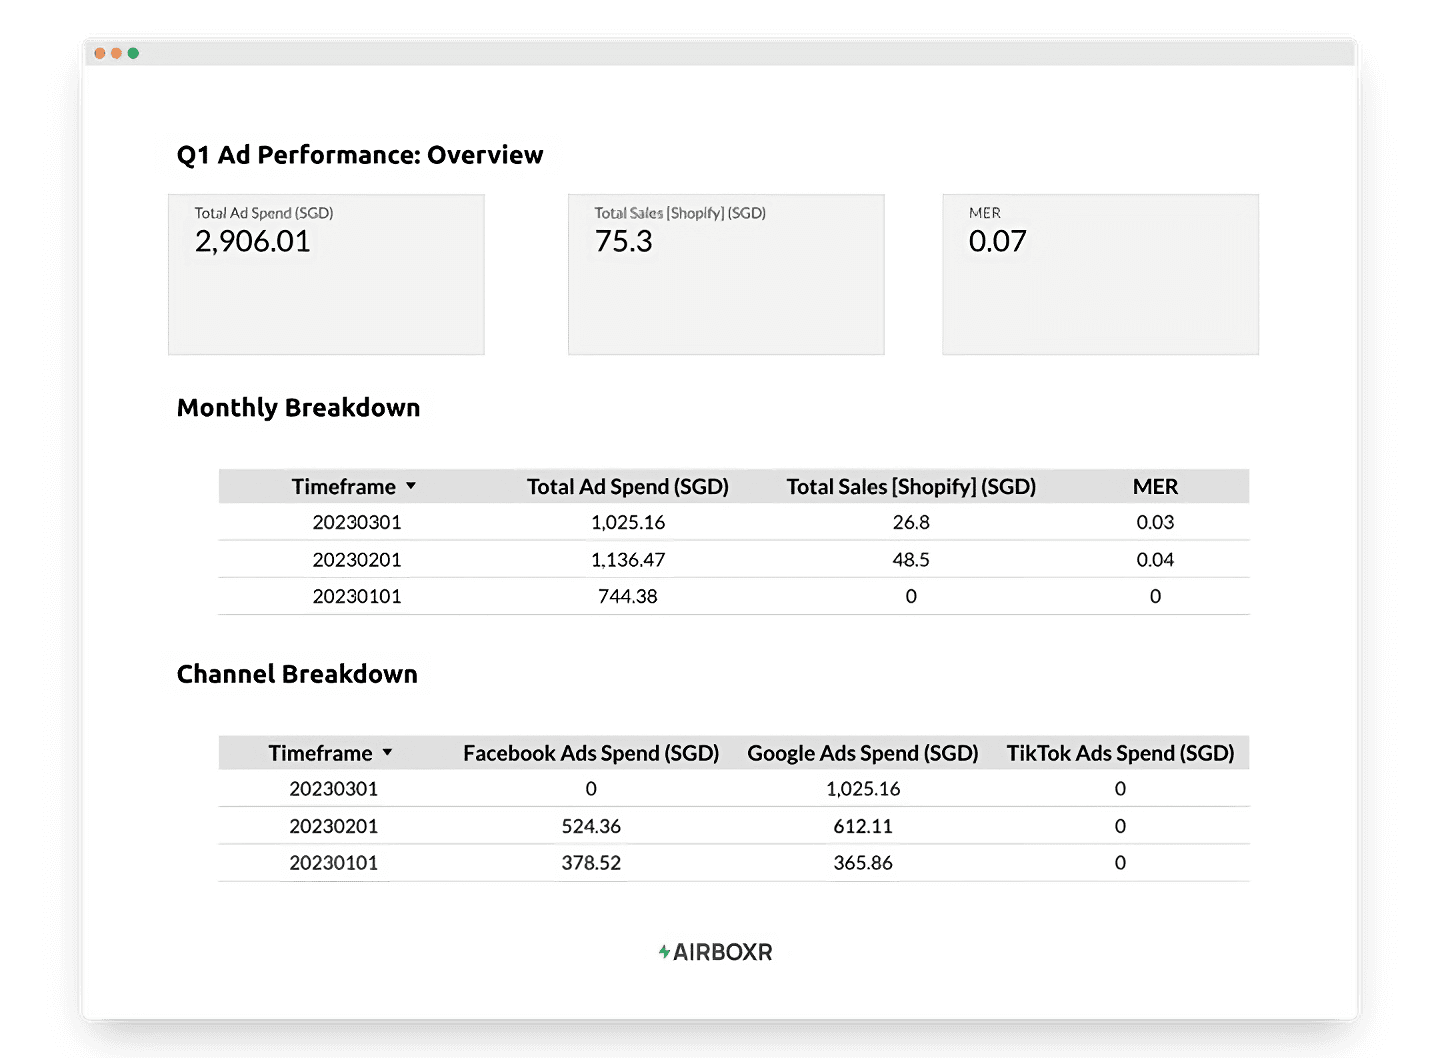
Before we begin, you may have already seen our article on how to create reports in Google Looker Studio that update automatically. If you’re not yet familiar with Looker Studio, do read that article for a much more detailed walkthrough to help you get started.
Step 1: Set up your Google spreadsheet
Looker Studio has a native connection with Google Sheets, so the easiest way to get your data into Looker is by putting it into a spreadsheet and linking the two. Read more about how to connect your Google Sheet to Looker Studio.
For our example, we will set up our spreadsheet using Airboxr Hops. Hops are automated queries into your store data.
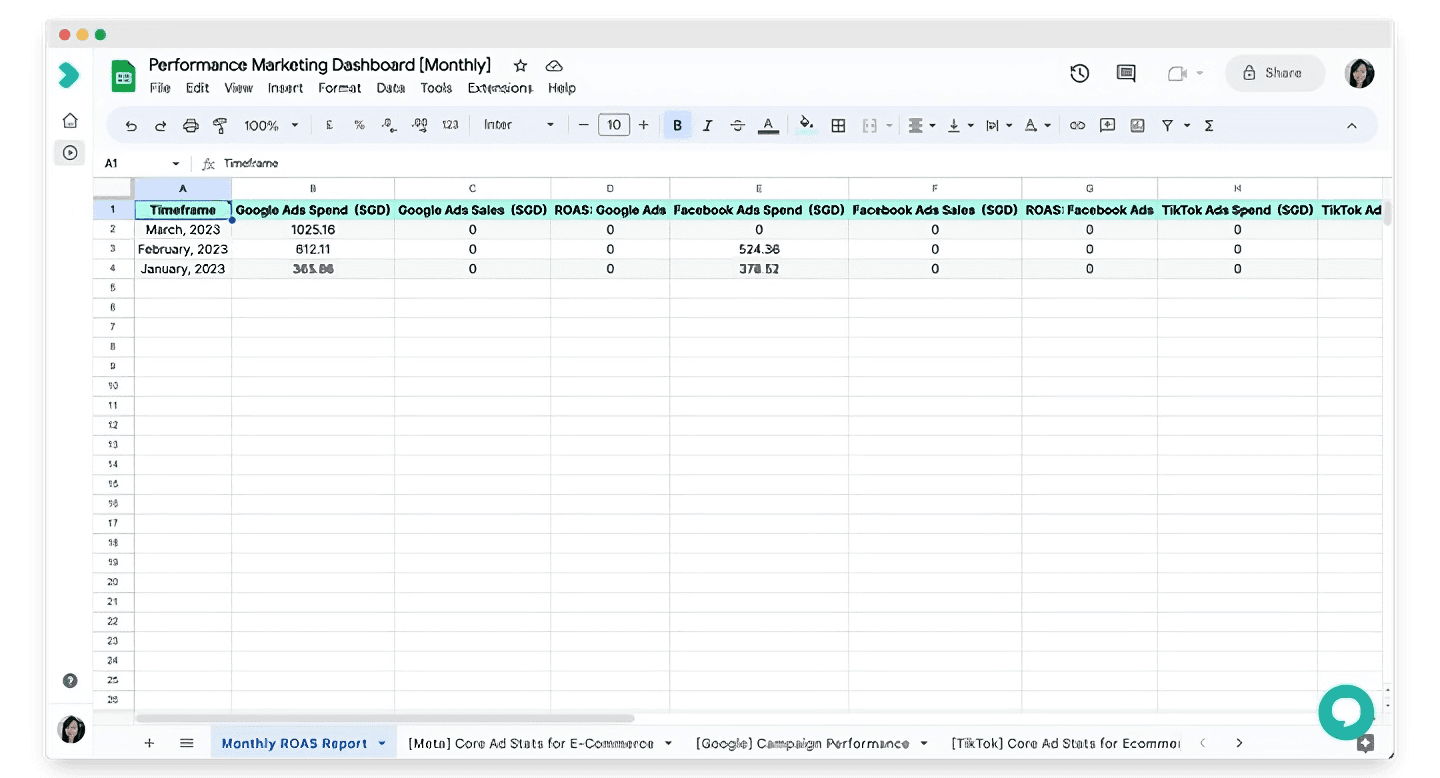
This is how our prepared spreadsheet will look like:
Which Hops do I use to set up my ad reporting dashboard?
As you can see, this dashboard is powered by four Hops, namely:
Find them all in the Hops Marketplace.
What timeframe should I run the Hops for?
If you’re doing a quarterly report, like we are, then run it for the relevant dates in the quarter (e.g. for a Q1 2023 report, select a custom date range from 1 Jan 2023 to 31 Mar 2023).
Run each Hop on a separate sheet. This will pull all your data into different worksheets in your Google spreadsheet.
Step 2: Set up your dashboard on Looker Studio
Now that we have our Google spreadsheet ready, we can create a Looker report and link it to our spreadsheet. Remember to add each separate worksheet as a new data source, so that you will have all the data in your Looker report.
Once all the data sources are connected, you’re good to go. You can start adding charts and graphs as you please, depending on what metrics you want to see.
What are some examples of ad performance reports I can make on Looker?
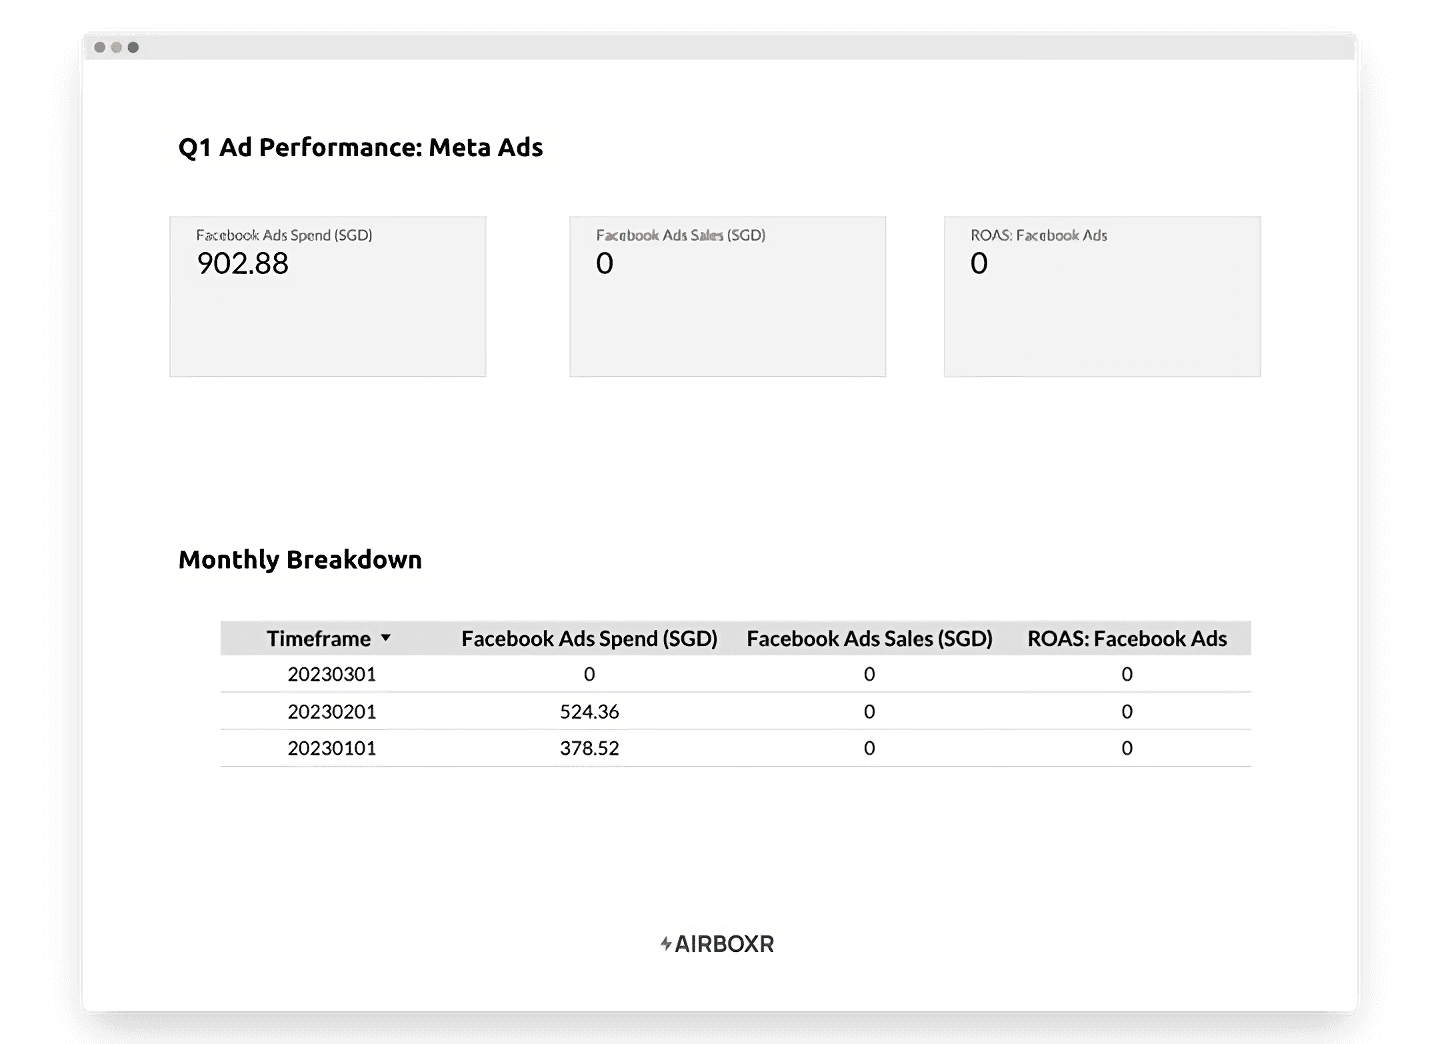
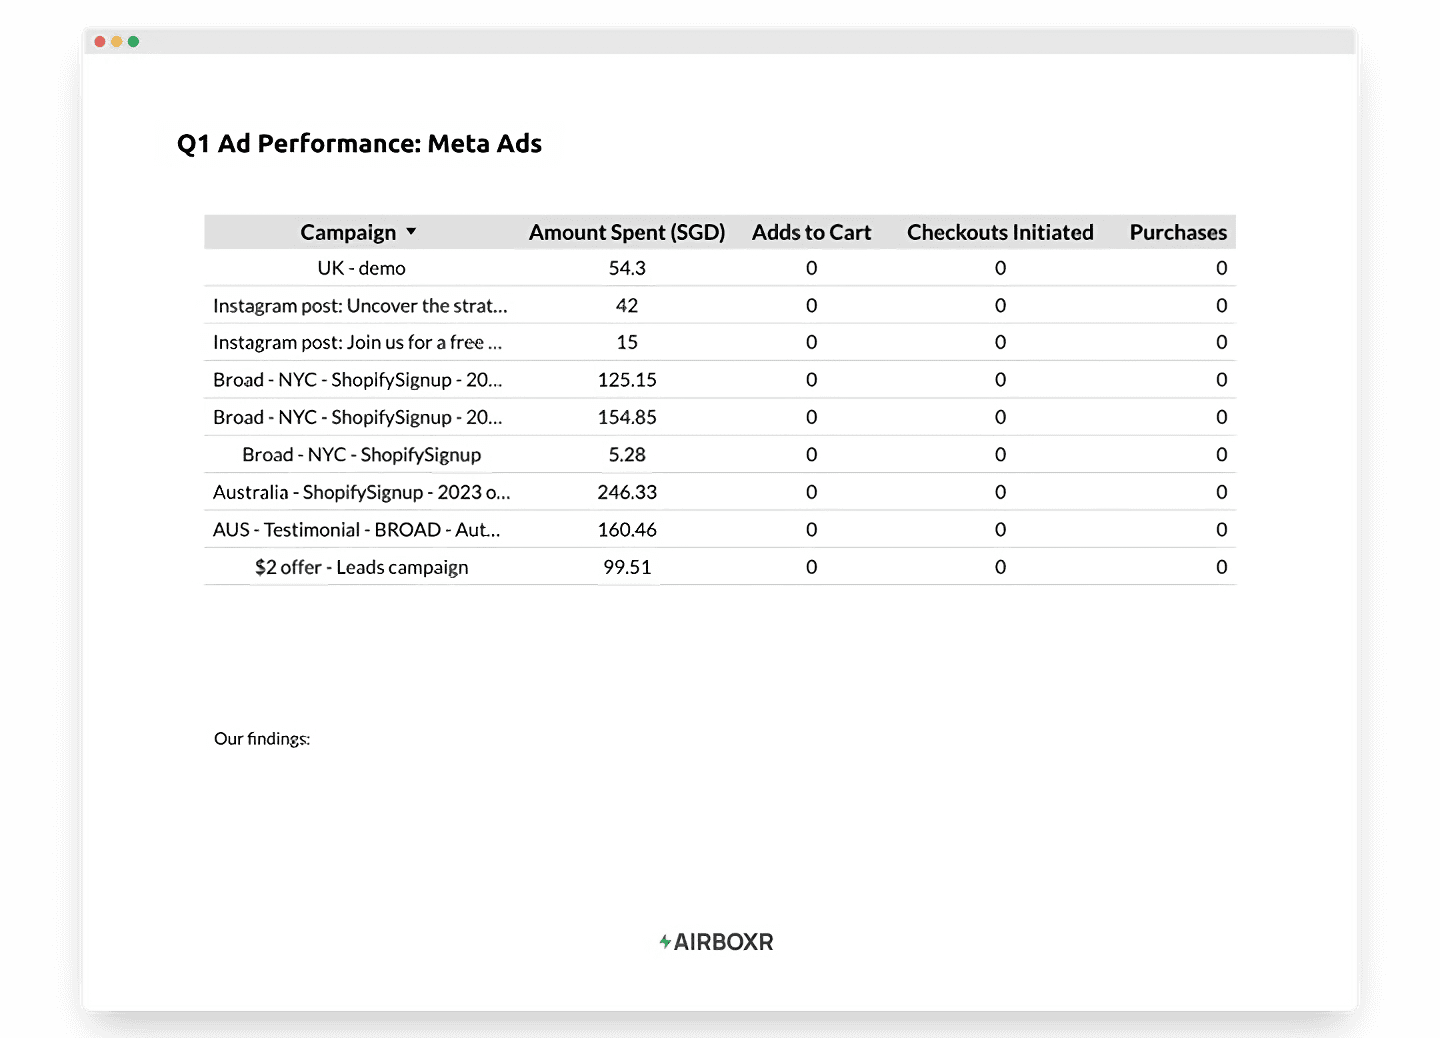
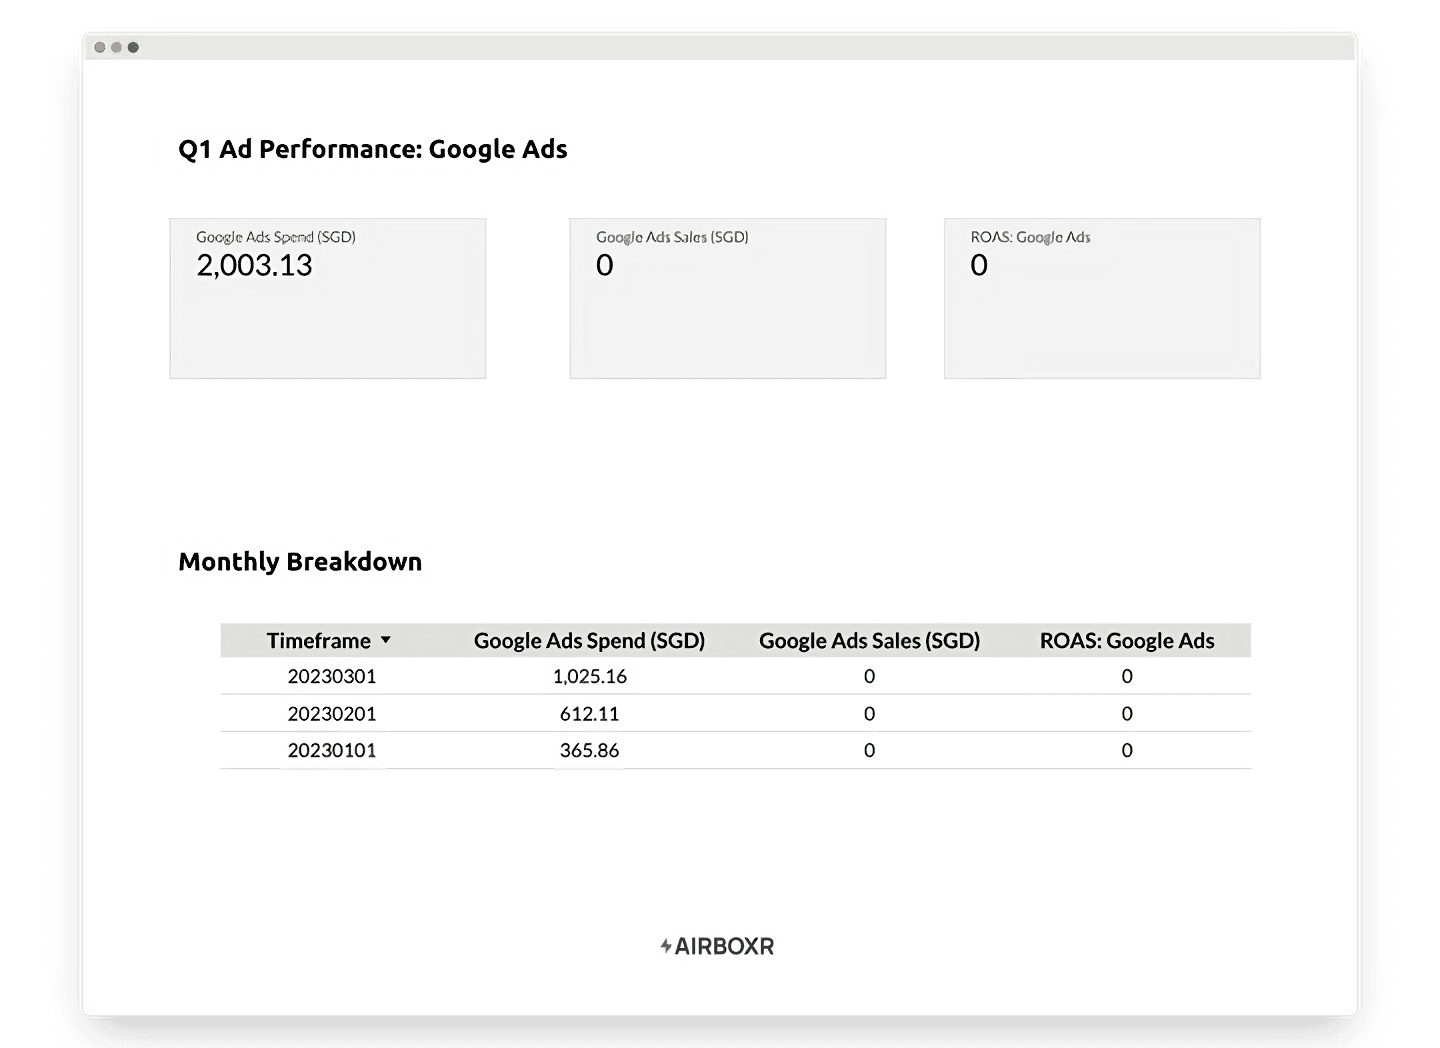
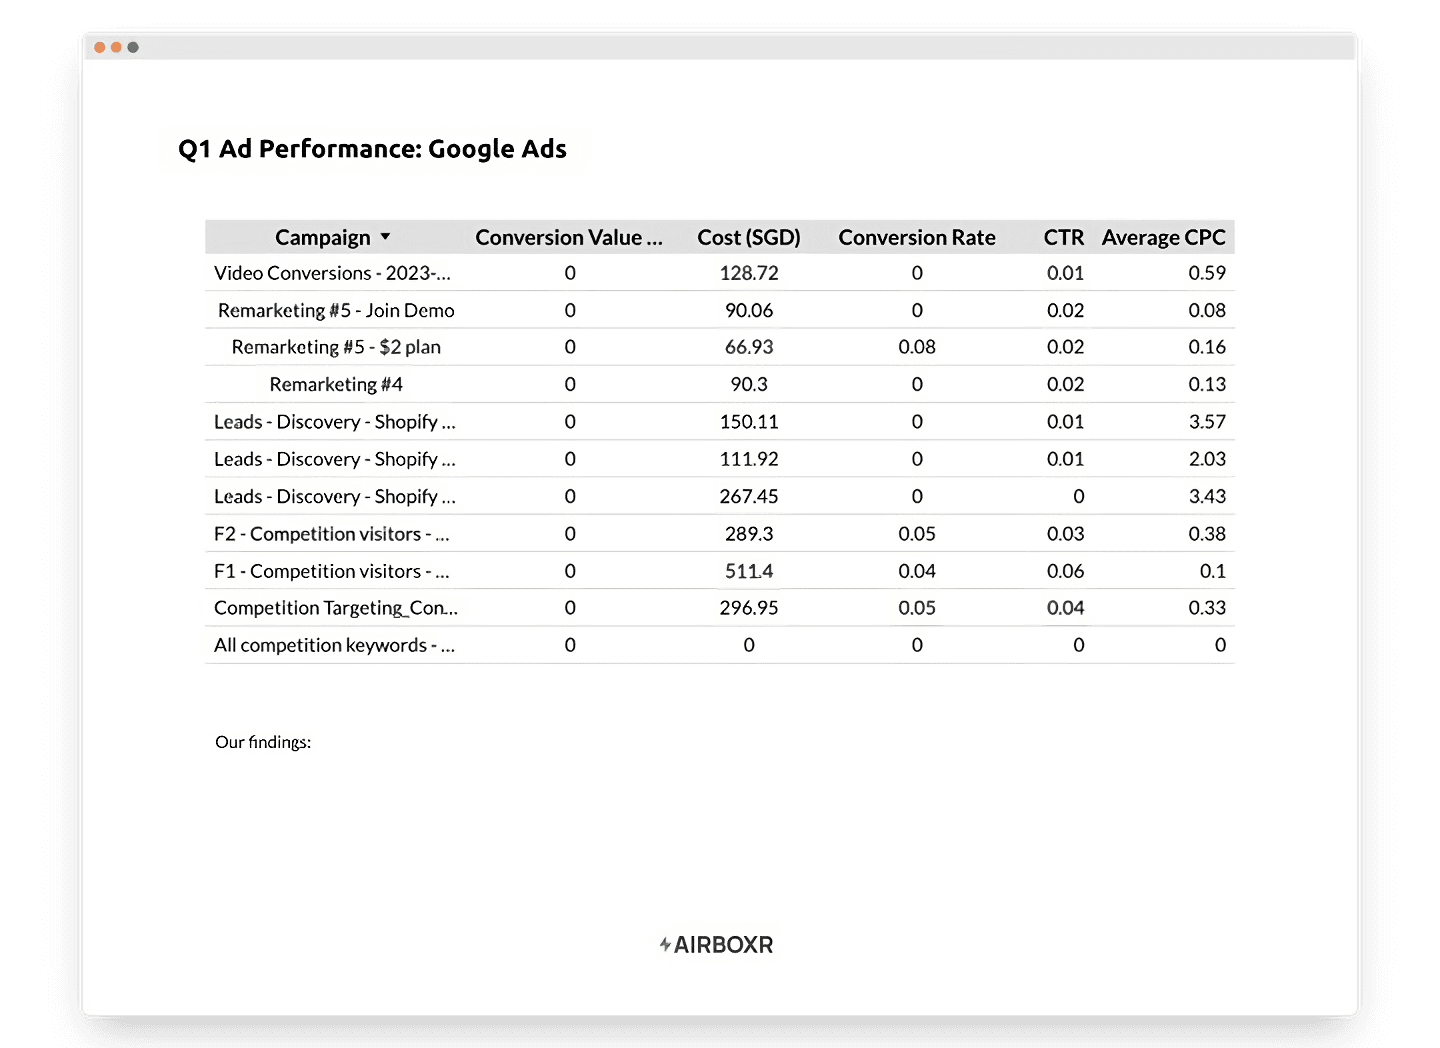
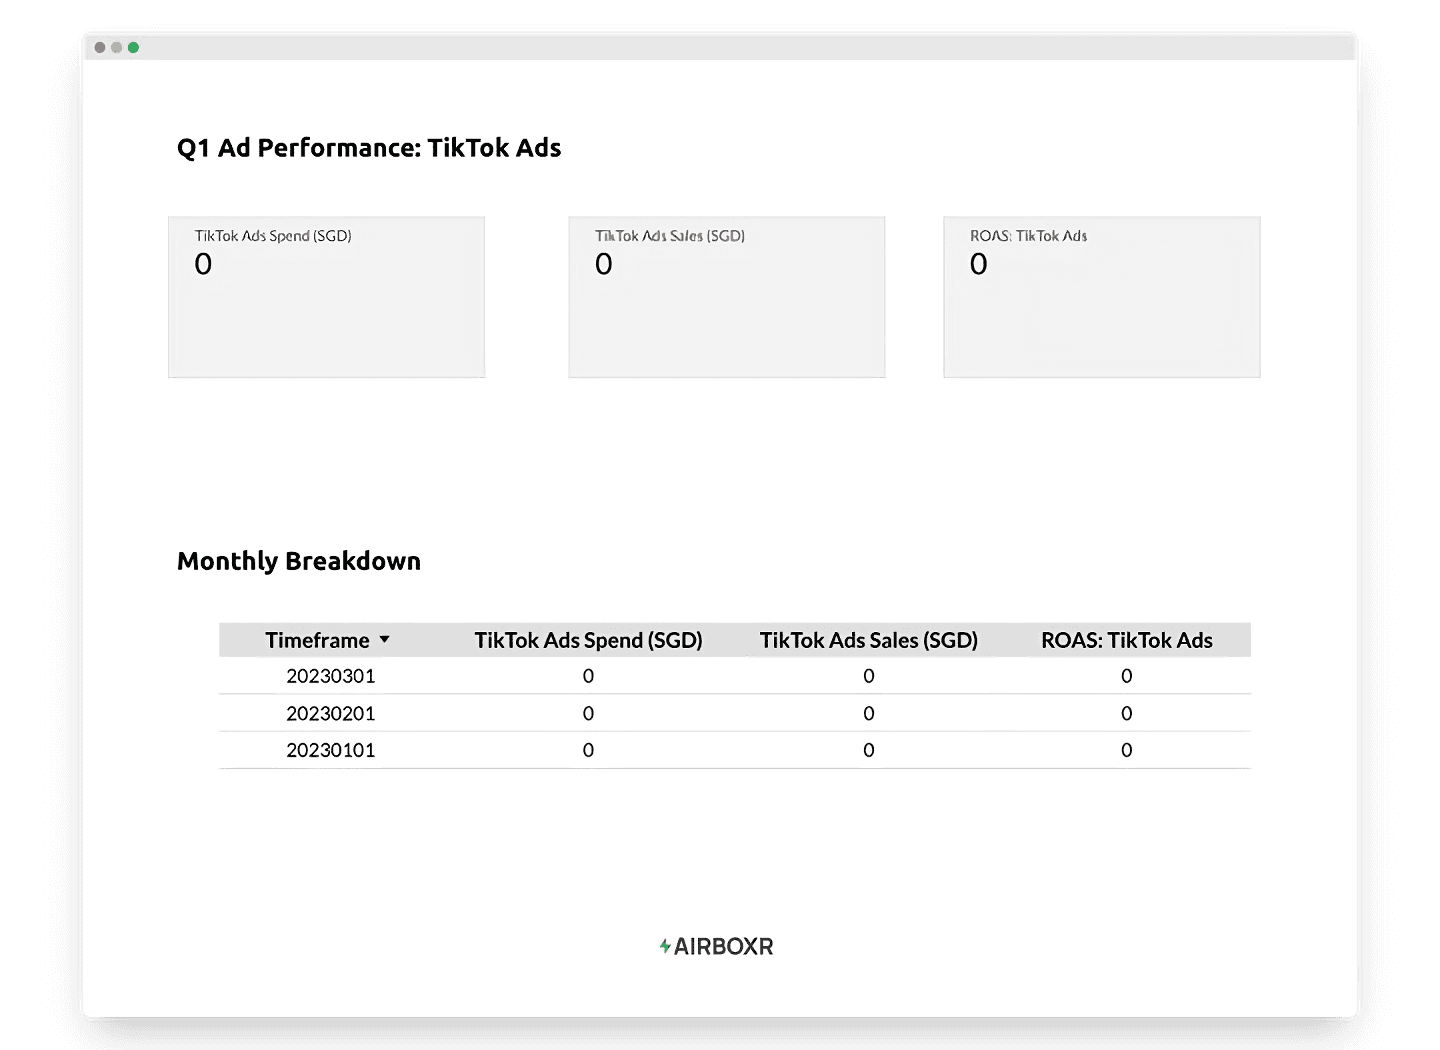
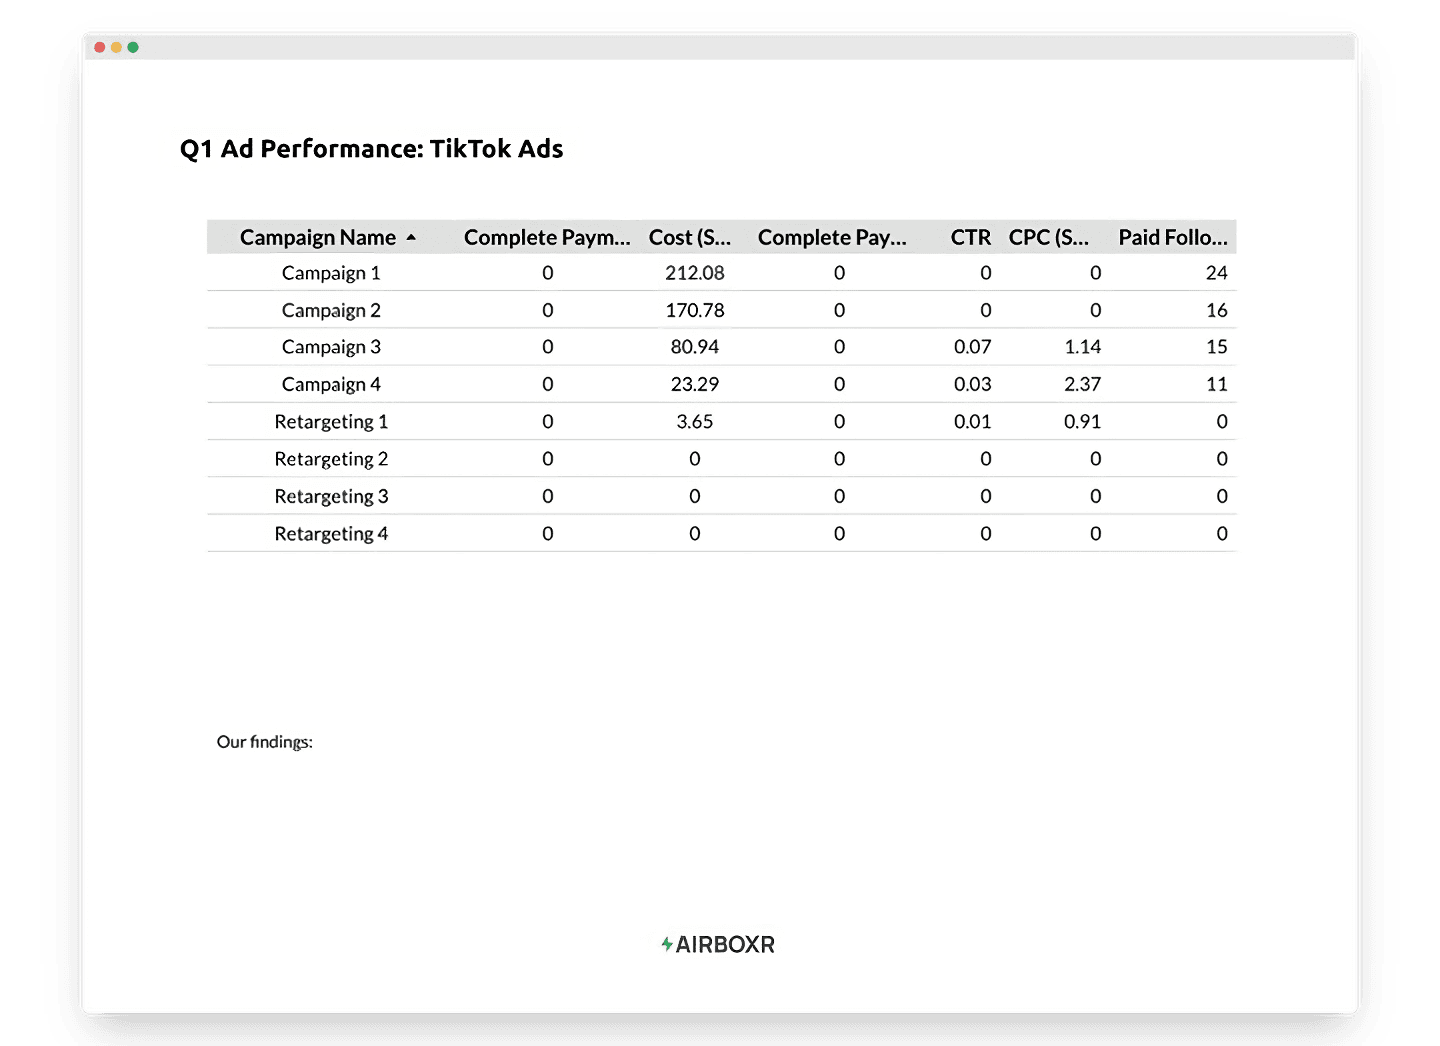
Here are some dashboards we created that you can take inspiration from.
Meta Ad
Google Ads
TikTok Ads
Improve your DTC game. Sign up for weekly tips.
I updated my spreadsheet. How do I refresh the data in my Looker report?
Easy—click on the three dots menu button on the top right hand corner of your Looker report, and select Refresh data.
Can I get your template and use it for myself?
Absolutely! We’d love to know who we’re helping, so write to us and we’ll email you a copy.
How do I get a Looker template custom made just for me?
We’re more than happy to help out our Airboxr users. Once you’ve logged in, simply ping us on the in-app chat and request for a template to be built for you.
