Reporting & Analysis
Apr 6, 2023
TLDR
You can track product sales by variant in Shopify using two methods: First, export sales data by variant to a CSV report in Shopify. Second, for more detailed and daily tracking, use Airboxr's 'Variant Sales over Time' Hop. Additionally, you can create automatic charts in Looker Studio for visualization, aiding data-driven decisions about inventory and marketing strategies. Airboxr streamlines the process, providing valuable insights into your product sales data.
From the moment you launch your new product line, one major question on your mind would be: which items sell the fastest. But that is rarely enough; if you’re in fashion, you also need to know which size sells the most, which material is more popular, and a hundred other combinations.
By understanding your product sales performance by variant, you are able to make critical business decisions like:
Reallocating marketing budget towards the sizes that are not selling as quickly
Reviewing your purchase orders to more accurately reflect demand by your customers
Choosing designs and styles that your customers tend to prefer
For example, let's say you run an apparel business and sell t-shirts in different sizes: small, medium, large, and extra-large. You can track sales by variant to see which sizes are selling the most. If you notice that small and medium sizes are selling the most, you can adjust your inventory accordingly and consider targeting your marketing efforts towards customers who are more likely to buy those sizes.
Another example is if you sell jackets in different colors, you can track sales by variant to see which colors are most popular. If you notice that black and navy blue jackets are selling the most, you can order more of those colors and perhaps run a marketing campaign that emphasizes the popularity of those colors.
Not knowing how your product sales are performing by variant can cost you dearly. As an example, after your campaign season, you might be left with 20% of excess stock in size S. This means you’ve missed out on sales of M because you didn’t have enough stocks - and on top of that, you’re stuck with excess stock in S, which becomes sunk costs.
In this article, we will discuss how to track Shopify sales by variant, using two methods:
As a bonus, we’ll also show you how you can set up a graph or chart showing your product sales performance by variant.
Export Shopify data into a CSV file and clean it in Google Sheets or Excel
To view unfulfilled sales by variant in Shopify:
Log in to your Shopify account and go to the "Products" page.
Select the product you want to track sales for and click on "Edit" to access the product details.
Scroll down to the "Variants" section.
In the variant details, you will see a section called "Inventory & Variants." Here, you can see the number of units available for that variant, as well as the number of units sold but which are still unfulfilled.
To track sales by variant over a specific time period:
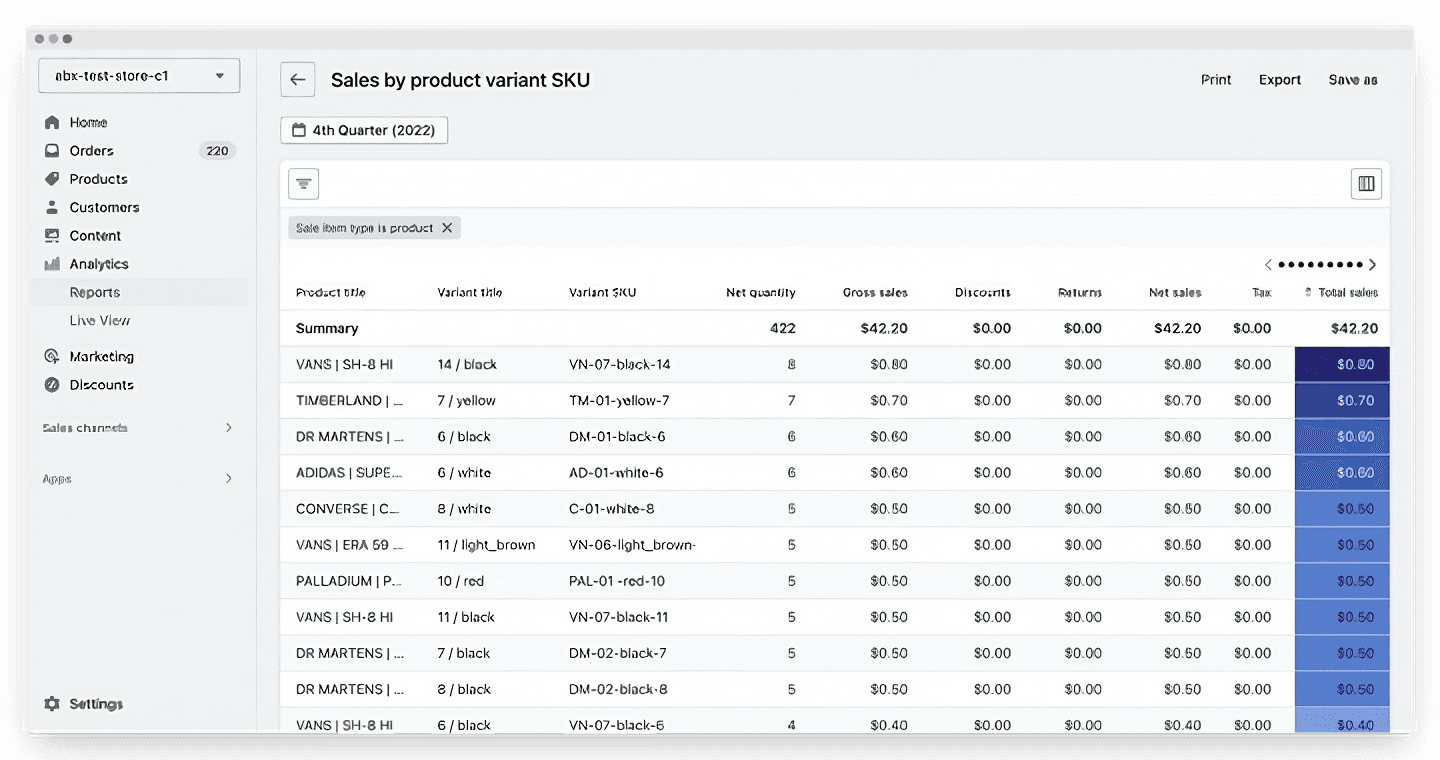
Go to the "Reports" page in your Shopify account (Analytics > Reports).
Select the "Sales by Product Variant SKU" report, which will show you the sales data for each variant over the selected time period.
Select more columns (click on the square icon on the top right hand corner of the report) if you want to see more
Export to a CSV file to filter, clean, and do more analysis.
Note that this report only gives you aggregate data over the time period you selected.

Use Airboxr’s ‘Variant Sales over Time’ Hop
If you want to actively track your product sales performance by variant on a daily basis, you would need a much more detailed report. This is where Airboxr comes in.
Here’s how you can find your product sales by variant over time using an Airboxr Hop, or pre-designed analysis:
Go to Airboxr’s Hop Marketplace.
Add ‘Variant Sales over Time’ to your Hops.
Select a timeframe (e.g. month to date).
Open a new sheet and run the Hop. Your data is ready!
You may also wish to filter this Hop by specific variants (e.g. size, color and so on) before running the Hop.
Here’s an example of us running the Hop on our demo store data, with no filters added:

Improve your DTC game. Sign up for weekly tips.
And here’s an example of us running the Hop filtered by one product, showing all its variants:

Bonus: Set up chart on Looker Studio that updates automatically
Once you have this report in your Google Sheets, linking it up to Looker Studio to update automatically is a breeze.
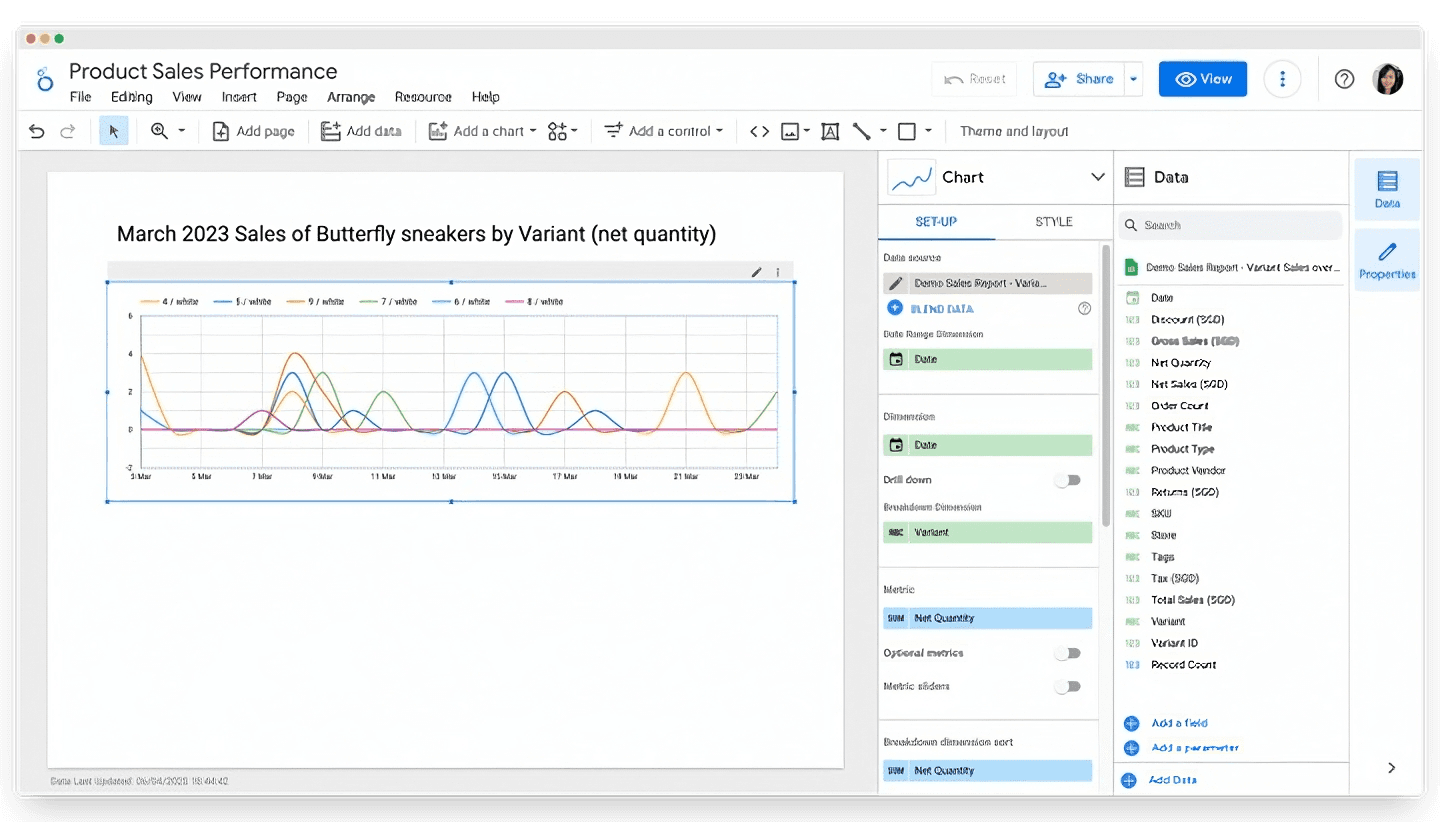
Here’s how a chart could look like in Looker Studio, showing you your variant sales over time:

This shows the quantity of items sold by variant on a timeline view. Take note of the set-up if you want to create the same for yourself.
Check out our video on how to link up your report to Looker Studio (or read the blog post):
In conclusion, tracking sales by variant in Shopify is a useful way for you to analyze your product sales performance and make data-driven decisions about inventory and marketing strategies. Having information as powerful as this enables you to make decisions that can increase your revenue in the multiples through more efficient allocation of resources, without needing to increase ad spend. For the most detailed and actionable reporting, use Airboxr to easily track sales by variant and gain valuable insights into your product sales data.


