Best Practices
Feb 25, 2022
TLDR
Huel, a meal replacement company, achieved remarkable growth with key business metrics. They track customer spend to identify top customers and conduct RFM analysis. Customer acquisition costs are monitored to optimize marketing strategies. Customer lifetime value is calculated and compared to CAC to assess campaign effectiveness. Tracking access channels helps prioritize marketing efforts based on traffic sources. Monitoring product performance informs marketing decisions and inventory management.
Huel has been gaining a lot of attention in the meal replacement space since its inception in 2015, with astonishing growth rates of 45-50% year on year. The company reported a £71.6 million turnover from July 2019 to July 2020, up £21.4 million on a year earlier, and is gearing up for public listing which could value it at up to £1b.
How did they manage to achieve such remarkable growth? In this article, we will look at the key business metrics that drive growth at Huel, and how you can track them for your e-commerce store.

Derived from the idea of “human fuel”, Huel products have a strong appeal to time-poor millennials who are also health and environmentally conscious. The company positions itself as “real food” made with nutritious plant-based ingredients with low carbon impact. Their website also claims Huel users (or “Hueligans”) can save five hours of meal prep time a week.
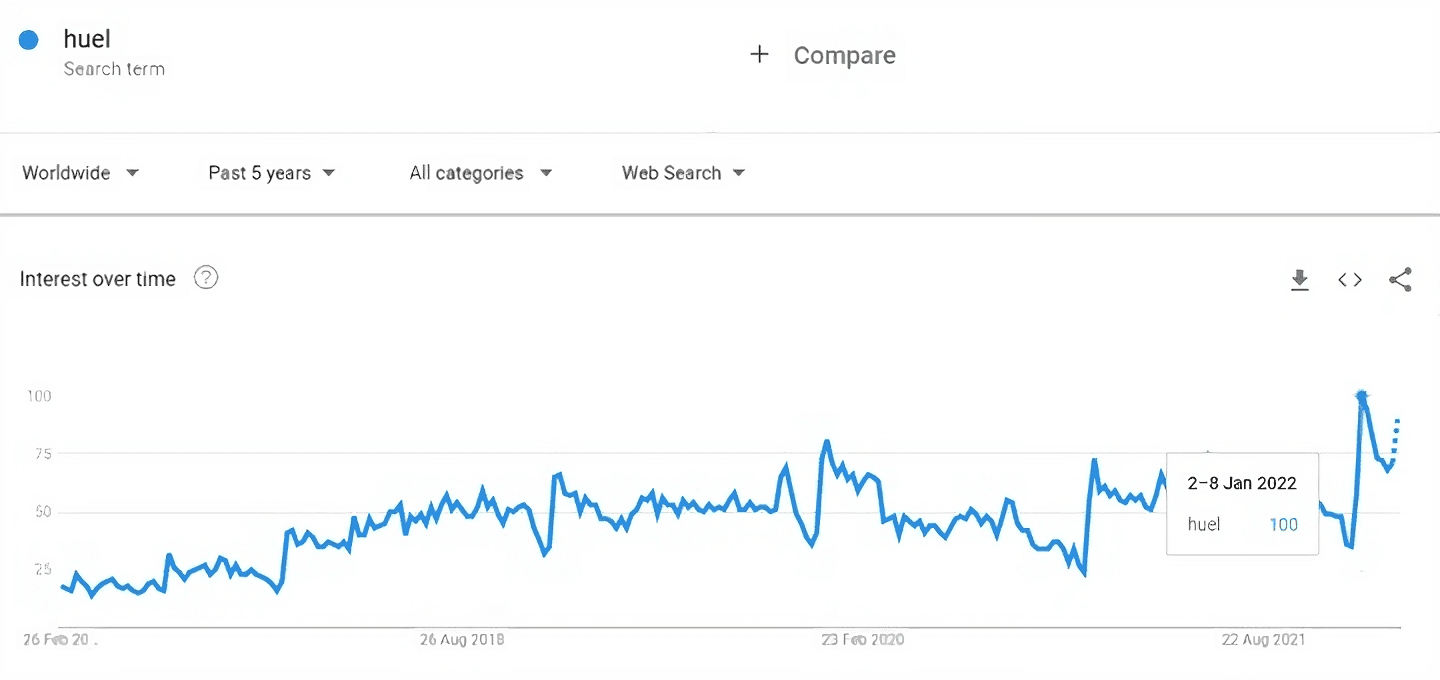
Search results on Huel are also reflecting a healthy growth in public interest in the brand over time, with searches hitting an all-time high in the first week of January this year. (Source: Google Trends)

Huel has been focused primarily on a direct to consumer (D2C) approach, which has helped them to build a strongly community-supported business and a product that takes into account direct customer feedback. Huel runs community forums on their website, a UK forum and a US forum, which sees daily activity and serves as a gold mine of information for the company, which they can compare against their tracked key metrics.
In a conversation with Huel’s founder, Julian Hearn, he shared how data and metrics form a core part of the company’s marketing and business decisions, including what metrics in particular are important:
Want to know more metrics? Get our Growth Works whitepaper for a list of 22 metrics and global benchmarks for your online store →
Track customer spend
The first metric Huel tracks is customer spend, namely, the total money spent by their individual customers on products sold by the company.
Shopify’s customers reports shows this information as Orders, under the column ‘Total spent to date’. This shows the total amount that a customer has spent, including taxes, discounts, shipping, and any refunds. In order to filter and edit your reports to see this column, you need an Advanced Shopify or Shopify Plus plan.
Knowing customer spend can help you identify your top customers. This allows you to prioritize and reward your most loyal fans, make personal connections with them, and turn them into evangelists. Knowing customer spend also helps you conduct RFM analysis on your customers, so you can prioritize which cohorts to focus your marketing efforts on.
Track customer acquisition costs
Another metric Huel tracks is customer acquisition costs. This is the amount of money spent by the company to get a customer to make their first purchase. This also includes repeat purchases, if the company also spends money on retention.
How you determine the customer acquisition costs depends on how and where the company spends money for acquisition. An example would be paid advertising.
Facebook’s Ads Manager, which runs ads on both Facebook and Instagram, shows this data in the Campaigns report under the column ‘Amount spent’.
Google Ads, which runs ads on both Google and YouTube, shows this data in the Campaigns report under ‘Cost’.
The total sum of these costs needs to be divided by the number of new customers acquired. This can be found in Shopify’s customers reports as customers whose first order falls within the time period of the campaign.
Knowing your customer acquisition costs helps you optimize your marketing strategies. It allows you to identify which outreaches are underperforming, and which ones are excelling at bringing in new customers. From there, you can adjust your marketing budget accordingly to increase the efficiency of your acquisition funnels.
Track customer lifetime value
Customer lifetime value is the total amount of money a customer is expected to spend before they stop being a customer. Customer acquisition costs are usually compared against customer lifetime value as a ratio.
This metric needs to be calculated, but there are some free tools that help with the calculation.
Knowing your customer’s lifetime value, in comparison with customer acquisition costs, gives you a more accurate view of the effectiveness of your marketing campaigns. If CAC is high but so is LTV, it’s worth spending that budget. Calculating the ratio of CAC to LTV also allows you to quickly understand how well the business is doing.
Improve your DTC game. Sign up for weekly tips.
Track access channels used by customers
Finding out which channels your customers are coming from can help you assess the effectiveness of marketing campaigns. Typical channels would be direct, referrals, search, social, mail, and display ads.
Google Analytics shows traffic sources to your website in their reports.
If you’re using Universal Analytics, go to Acquisition → All Traffic → Channels.
If you’re using Google Analytics 4 (GA4), go to Acquisition → Traffic Acquisition.
You can also use our Source/Medium performance template to get an overview of your main traffic sources. Simply connect it to Google Analytics and refresh the template data on Airboxr to populate it with your own data.
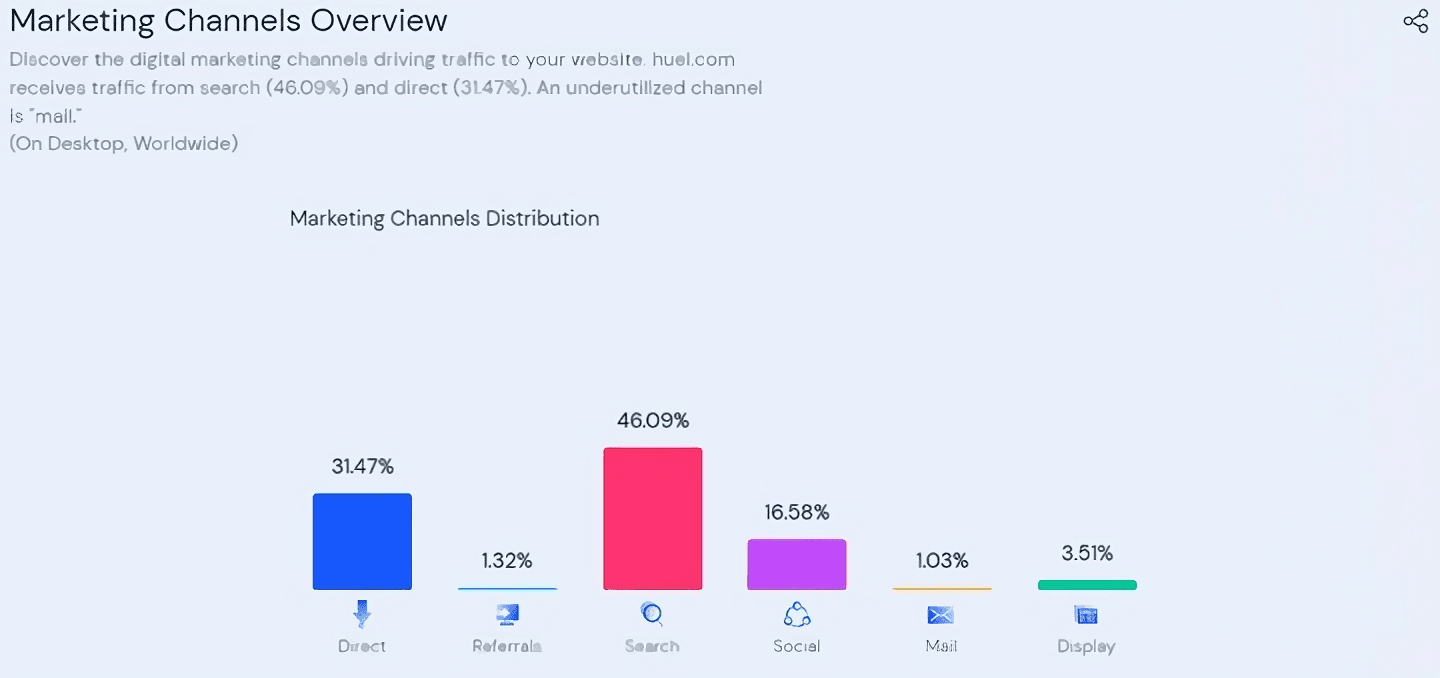
At the moment, search (46.1%) is Huel’s biggest marketing channel, followed by direct access (31.5%). (Source: Similarweb)

Knowing which channels are bringing in the most traffic to your site helps you prioritize which marketing channels to double down your efforts on. For example, if e-mail marketing is identified as an underutilized channel and your retention rates are also low, you may wish to spend some time focusing on this channel.
Track product performance
Huel uses real-time information on product performance to inform their marketing strategies. Knowing your product performance (bestsellers, etc) can also help you make decisions on marketing, as well as inventory management for your Shopify store.
Shopify’s product analytics reports shows metrics such as net sales, sales breakdown, net sales by channel, net units sold by traffic source, and customers for each product.
Knowing your product performance can also help you make decisions on marketing, for example boosting ad spend on a particular bestseller during a particular time period or even day of the week. It also allows you to gauge the potential of new product launches - Huel’s launch of their hot & savoury products boosted sales by 20%, so they are likely to continue marketing those products. Finally, keeping an eye on product performance helps with inventory management, so you can plan for restocks ahead of time.


